Why are more people living in cities worldwide? (WJEC Eduqas GCSE Geography B): Revision Note
Exam code: C112

Specification link
This page covers section 1.1.1 of the WJEC Eduqas GCSE specification.
1.1.1 - To what extent is urbanisation a global phenomenon?
Global-scale patterns and how these patterns vary over time and space.
Concepts of urbanisation and re-urbanisation.
The concept of global cities.
The development over time and the present location and distribution of global cities.
Global scale and patterns of urbanisation
Urbanisation is the process by which an increasing percentage of a country's population comes to live in towns and cities
Urbanisation varies across the globe and between countries at different levels of development
High-income countries (HICs) show the highest levels of urbanisation
The lowest levels of urbanisation are in low-income countries (LICs) such as Africa and Southeast Asia
Globally, more people now live in towns and cities than in rural areas
According to the UN, 55% of the world's population lives in urban areas
This is predicted to increase to 68% by 2050
The world population doubled between 1950 and 2015, but the urban population more than tripled due to:
The decline of industry in high-income countries (HICs) occurred as industries relocated to newly industrialised countries (NICs) to benefit from:
A cheaper workforce
Government incentives
Tax breaks and other advantages
This led to rapid industrial growth of NICs in Asia and Latin America and 'pulled' people from rural regions to urban areas, with the hope of a better life and employment
Processes driving urbanisation
Rural–urban migration
People move to cities due to a mix of push-pull factors
Push factors include:
Unemployment
Lack of services
Low income
Environmental problems such as drought
Pull factors include:
Better jobs
Education
Healthcare
Improved living conditions
In Mumbai, many migrants move from rural Maharashtra or Uttar Pradesh seeking employment in manufacturing and services
In Sydney, international migrants arrive for high-skilled jobs and a better quality of life
Natural increase
Young people migrate to cities, increasing the number of births
Improved healthcare reduces death rates, contributing to rapid population growth
This process is especially strong in NICs such as India, where over half the population is under 30 (UN Population Division, 2024)
Examiner Tips and Tricks
Natural increase does not include the inward migration of people to a place, just the number of births vs. the number of deaths. E.g. On one street, there were five new migrants, 10 births, and two deaths. The natural increase is eight people because the migrants chose to move there. If they went on to have children, the natural increase rate would include those offspring.
Rates of urbanisation are lower in HICs, as a high percentage of the population already lives in towns and cities
In some developed countries, rates of urbanisation may start to decrease as counter-urbanisation occurs
Government policies – Some governments actively encourage urban growth by investing in cities and infrastructure
China, for example, has rapidly urbanised through deliberate government planning
Other countries might focus more on rural development
Rates of urban growth
HICs
Rate of urban growth: Slow or declining
HICs have lower rates of urbanisation, as towns and cities already exist
Example: UK, Germany, Japan, and America
Cause: The industrial revolution 'pulled' the population into developing urban areas at that time
Nowadays, many people in HICs are being 'pushed' (counter-urbanisation) away from overcrowded cities to rural settlements
HICs tend to have good transport and communication networks; therefore, people can live in rural areas while commuting to cities or working from home
NICs
Rate of urban growth: Rapid
Example: India, Russia, Brazil and China
Cause: These areas are becoming key trade hub cities and are seeing greater growth than others due to investment from the government and MNCs
Cities such as Lagos in Nigeria, Shanghai in China, Mumbai in India, Sao Paulo in Brazil and St Petersburg in Russia – none of these are the country's capital
Trade such as finance, electronics and manufactured goods
LICs
Rate of urban growth: Fastest rates of urbanisation
Example: Sub-Saharan countries, including Rwanda and Ethiopia. Asian countries like Vietnam, Bangladesh, and the Philippines are expected to contribute 60% to global growth by 2030
Cause:
Economic development is concentrated in the big cities
Investment in low-cost manufacturing of textiles, garments and shoes
High rates of rural-to-urban migration
High levels of natural increase in population

The concept of global cities
As the growth of cities continues, the term 'megacity' is used to describe cities with more than 10 million people
In 1970, there were only 4
By 2000, there were 15
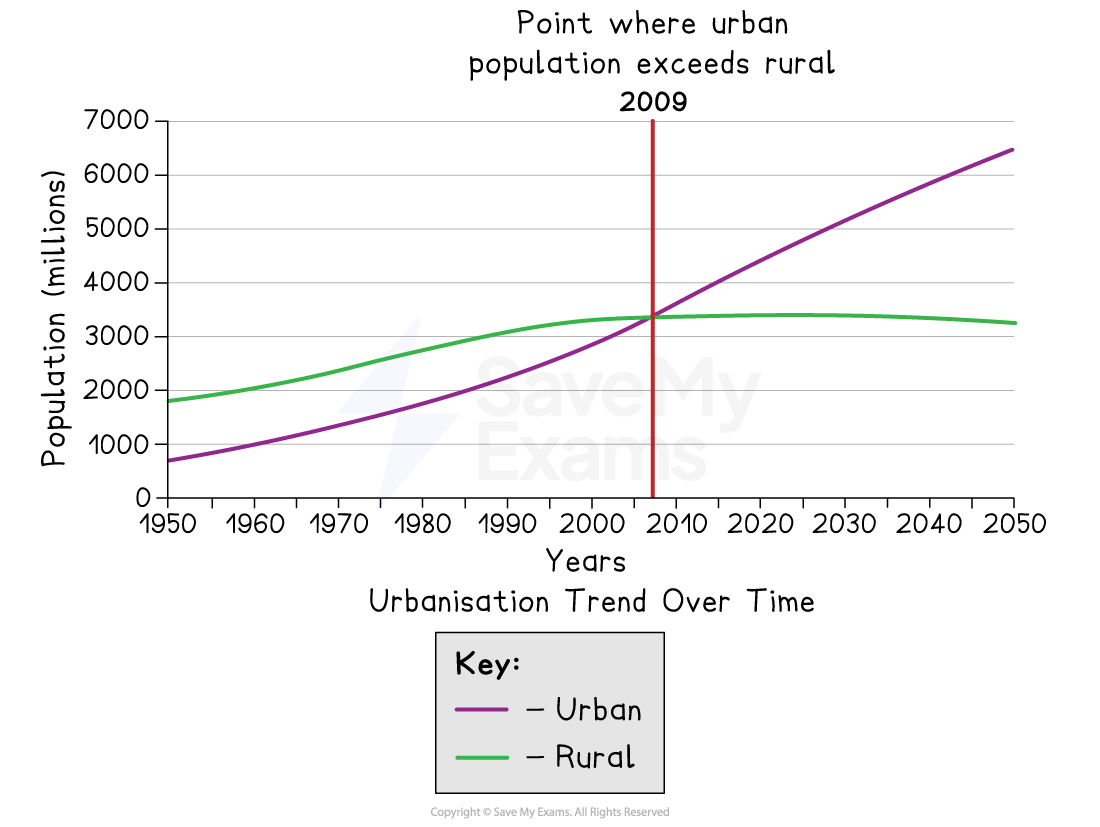
2007 saw more people living in an urban environment than in a rural one
In 2018, that rose to 33
The largest growth of megacities is seen in Asia – Tokyo has close to 37.3 million people
By 2050 it is thought that more than two-thirds (7 billion) of the world population will live in urban areas
This scaling up of the urban environment is the fastest in human history
Reasons for growth
Four main factors:
Economic development
Encourages population growth, which leads to the desirability of goods and services
All megacities act as service centres within the formal economic sector
However, megacities in LICs are also important manufacturing centres (Mumbai in India or Dhaka in Bangladesh), with thousands working in the informal economy
Population growth
Young people are drawn to live in megacities with their vibrancy, fast pace and opportunities
There is also ‘internal growth’, where people who have moved into the cities have children, thus sustaining population growth (Mexico City, Mumbai, Pearl River Delta in China)
Economies of scale
It is cheaper to provide goods and services in one place than spread across several cities
Financial savings for local governments in respect of infrastructure provision
Communication and transport are centralised, making savings in time and money
Multiplier effect
As a city prospers, it acts as a beacon to people and businesses
This encourages inward investment
This leads to yet more development and growth
Generating further need for skills and labour and job growth
This cycle multiplies the positive effects, and growth continues (San Francisco and the digital development)
Global cities
Megacities have a powerful attraction for people and businesses with influential cores and large peripheries
However, global cities are major urban centres that act as strategic hubs in the world's economic, financial, and cultural network
Global cities can be any size, but they exert particular influences around the globe
Some cities, like Tokyo, are both global cities and megacities
They are
Influential, with status and power
Critical nodes in the global economy
Centres for culture, communications and political processes
Hubs of innovation
Examiner Tips and Tricks
It is important to remember that global cities do not have to be megacities. For instance, London fluctuates between megacity status based on inward migration and natural birth rates, yet it remains an Alpha++ global city.
How connected a city is to the rest of the world and the global economy determines its category
The top two (Alpha++) are London and New York
These are the financial centres of the world, each with smaller networks of global cities feeding into them
Alpha+ cities are highly connected to the global economy
Alpha and Alpha- cities link major economic regions and states into the world economy
Beta-level cities link their region or state to the world economy
Gamma-level cities link smaller regions or states into the world economy, or to other global cities
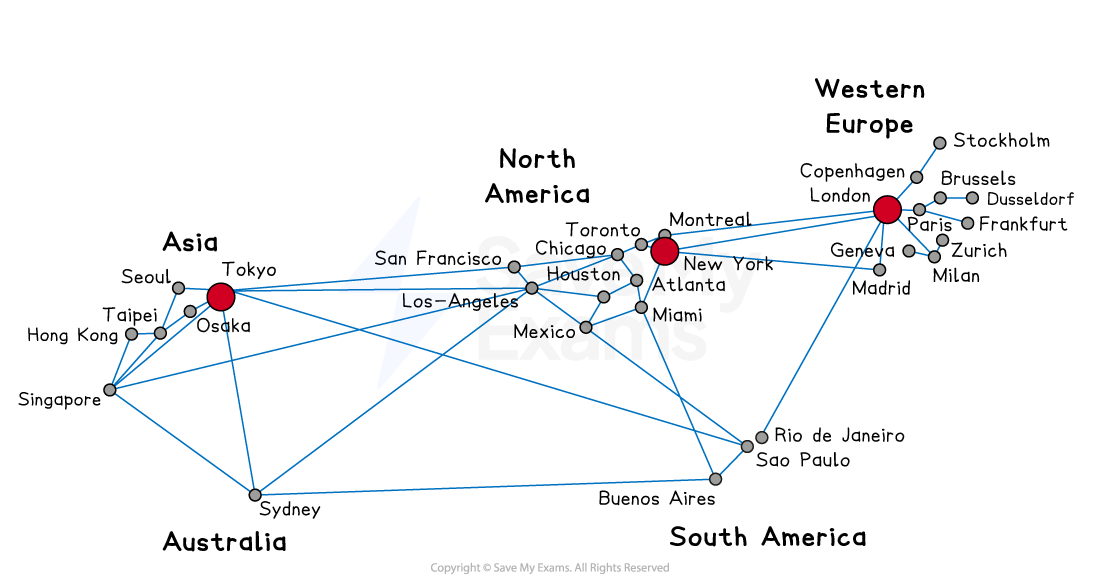
High-ranking examples of global cities include:
North America: Los Angeles, San Francisco, Washington D.C., Boston
Europe: London, Paris, Zurich, Berlin
Asia: Tokyo, Shanghai, Singapore, Hong Kong, Beijing
Oceania: Sydney, Melbourne
According to GaWC (opens in a new tab), as of 2024, Africa has 10 global cities:
Cairo, Egypt
Casablanca, Morocco
Lagos, Nigeria
Nairobi, Kenya
Tunis, Tunisia
Accra, Ghana
Kampala, Uganda
Dar Es Salaam, Tanzania
Cape Town and Johannesburg in South Africa
Johannesburg is an Alpha city and Sub-Saharan Africa's leading global city
Rapid urbanisation
Rapid growth can create serious social, economic, and environmental problems, especially in NICs and LICs
Social challenges
A shortage of housing leads to informal settlements or 'slums', overcrowding, and poor sanitation
Economic challenges
Unemployment or underemployment occurs because job creation cannot keep pace with population growth
Environmental challenges
Air and water pollution, waste disposal issues, and the spread of informal housing in hazardous areas such as floodplains
Example – Mumbai:
Dharavi slum houses nearly one million people in just 2.1 km², showing the pressure of rapid urban growth (BBC News, 2024)
In contrast– Sydney:
The city faces challenges of housing affordability, urban sprawl, and transport congestion rather than slum development (NSW Government, 2024)
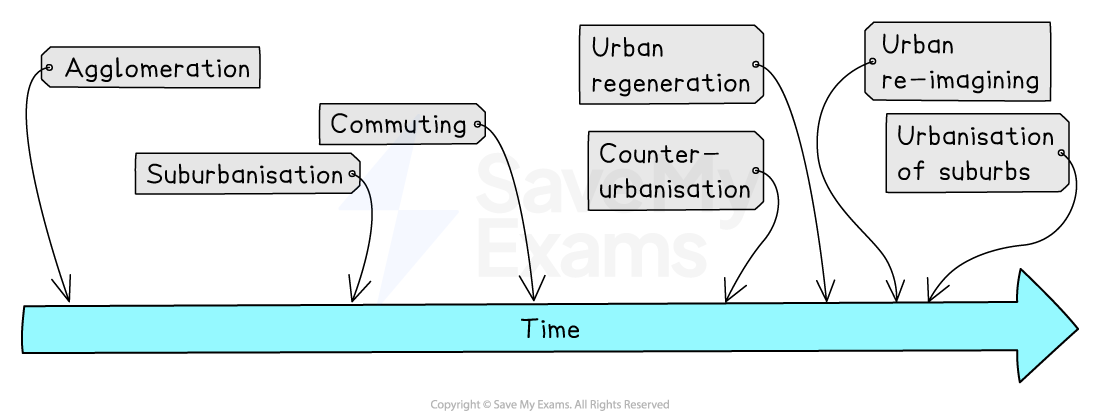
Urbanisation and re-urbanisation
In HICs, urbanisation has slowed, and some cities are experiencing re-urbanisation
Former industrial cities like Manchester and Glasgow have seen populations rise again after decades of decline
This shows that urbanisation is an ongoing global process, but occurs at different speeds and for different reasons, depending on economic development
Urbanisation as a global phenomenon
Urbanisation affects every continent as it is a global process
However, the rates, causes, and consequences differ between countries
The process began earlier in HICs but is now most rapid in NICs and LICs
By mid-century, almost all regions will be majority urban, although Africa and parts of Asia still have large rural populations
Therefore, urbanisation is global in reach but unequal in pace and impact
Worked Example
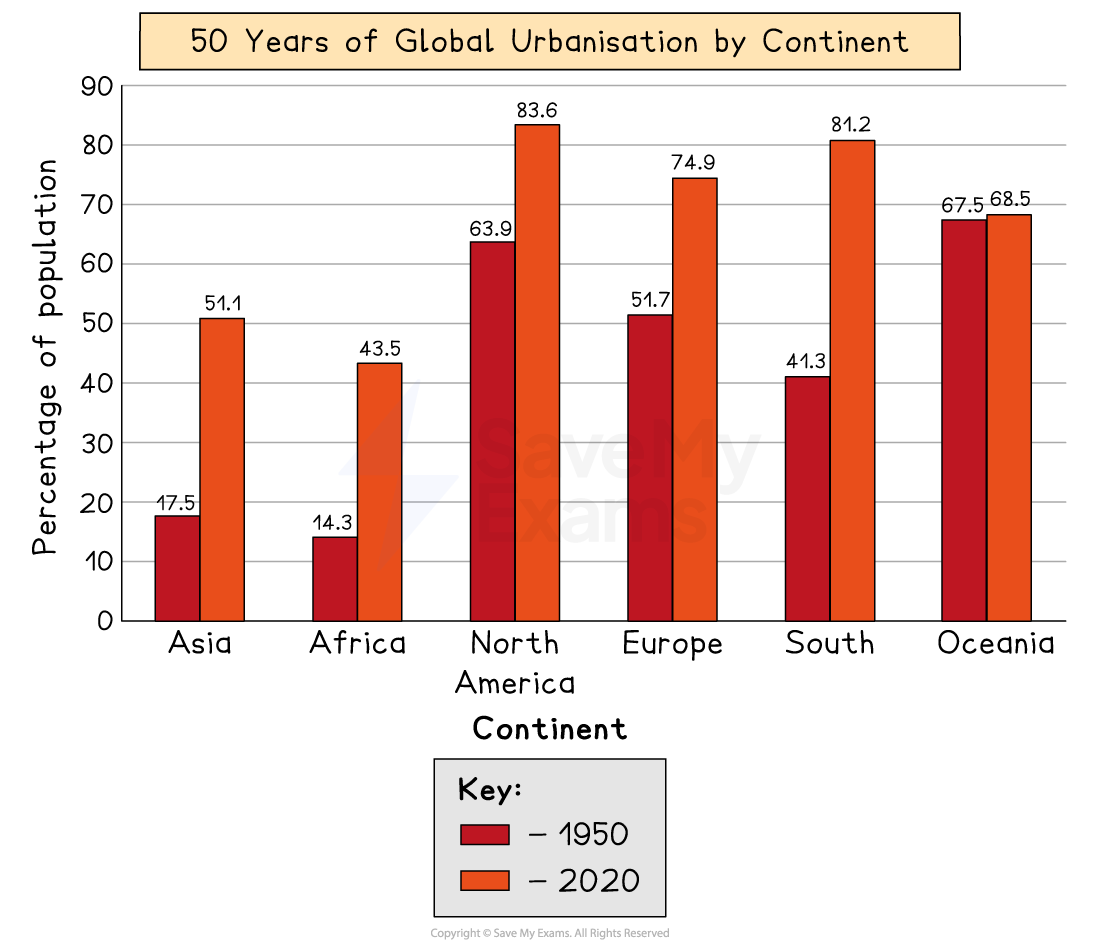
Describe the global pattern of urbanisation shown in Figure 1.
[4 marks]

Answer:
Urbanisation is higher in developed regions, such as North America and Europe, where over 74% of people live in cities. [1 mark]
In contrast, most of Africa and Asia have urban populations below 52%. [1 mark]
Urbanisation is growing fastest in Asia and Africa. [1 mark]
This graph shows that while all regions are urbanising, the pace is greatest in developing countries. [1 mark]
Marking guidance:
1 mark for identifying a pattern
1 mark for comparing regions
1 mark for using examples
1 mark for summarising the overall trend
Examiner Tips and Tricks
Many students lose marks by simply listing countries rather than describing patterns. Always compare where urbanisation is high and low and support your description with examples from the information provided.

Unlock more, it's free!
Join the 100,000+ Students that ❤️ Save My Exams
the (exam) results speak for themselves:

Was this revision note helpful?
