Practical: Osmosis and Diffusion (SQA National 5 Biology): Revision Note
Exam code: X807 75

Written by: Cara Head
Updated on
Investigating transport across the membrane
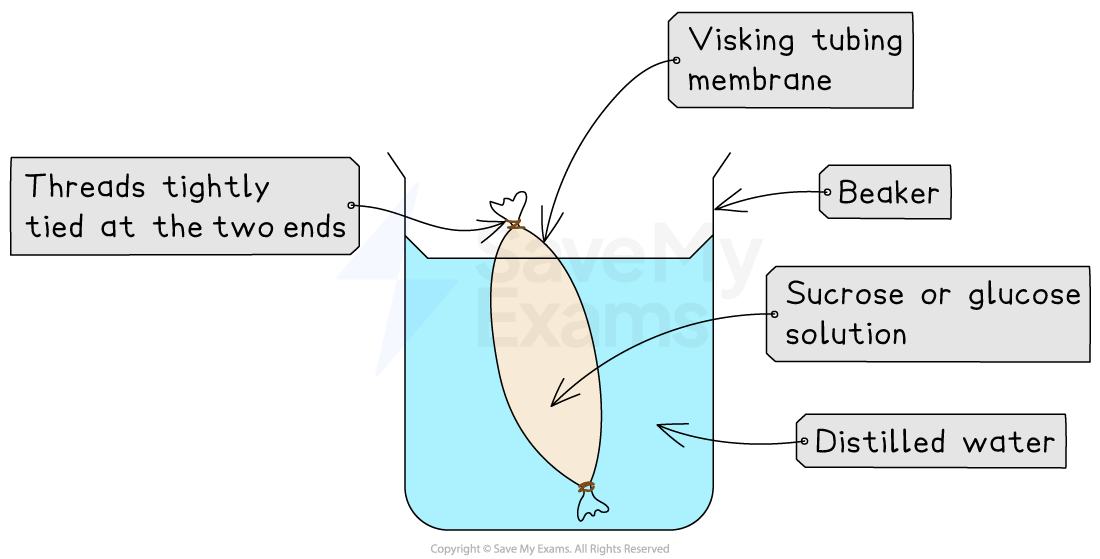
Visking tubing can be used to model the effect of osmosis on a cell
Pores in the tubing are small enough to prevent the passage of large molecules, e.g. starch, but allow smaller molecules, e.g. glucose, to pass through by diffusion
Examiner Tips and Tricks
Note that this practical is a 'suggested practical' in the specification, rather than content that all students are expected to learn. Some schools may choose to complete alternative practicals, or may miss out practical work that is not realistic, e.g. due to equipment or time constraints
Apparatus
Visking (dialysis) tubing
Beakers
String or clips to tie ends of tubing
Distilled water
Sucrose or glucose solutions of different concentrations (e.g. 0%, 5%, 10%, 20%)
Pipette or syringe
Measuring cylinder
Balance
Stopwatch
Paper towel
Method
Soften the Visking tubing by soaking it in water to make it flexible
Tie one end of the tubing securely with string or a clip
Fill the tubing with a known volume of sucrose or glucose solution, e.g. 10 ml
Tie the other end to form a sealed “artificial cell”
Rinse and dry the outside of the tubing, and use a balance to record its initial mass
It is important to dry the tubing so that water on the outer surface does not affect the mass
Place the tubing into a beaker of distilled water
Or a different concentrations of sucrose solution for comparison
Leave for a set time, e.g. 30–60 minutes
Remove the tubing, blot dry again, and record the final mass
Compare mass changes between samples in different solutions
Expected results
External solution | Observation | Explanation |
|---|---|---|
Distilled water | Tubing volume and mass increases | There is a higher water concentration outside the tubing so water moves into the tubing by osmosis |
Sucrose solution of equal concentration | Little or no mass change | No difference in water concentration so there is net water movement |
Concentrated sucrose solution | Tubing volume and mass decreases | There is a higher water concentration inside the tubing so water moves out of the tubing into the surrounding solution by osmosis |
Limitations
Limitation | Possible solution |
|---|---|
Visking tubing is not a biological membrane | State explicitly this is a partial model used to illustrate osmosis, and that it does not perfectly replicate osmosis in cells |
No cell wall so can’t show turgor or plasmolysis in plant cells | Pair with a plant tissue osmosis practical (e.g. onion cells) to demonstrate turgor and plasmolysis effects |
Investigating osmosis
It is possible to study osmosis by investigating the effect of solute concentration on osmosis in plant tissue
Examiner Tips and Tricks
Note that this practical is a 'suggested practical' in the specification, rather than content that all students are expected to learn. Some schools may choose to complete alternative practicals, or may miss out practical work that is not realistic, e.g. due to equipment or time constraints
Apparatus
Potato cylinders (cut using a cork borer)
Ruler and scalpel
Distilled water
Sucrose or salt solutions of different concentrations (e.g. 0.0 M – 1.0 M)
Test tubes or beakers
Balance (for measuring mass)
Paper towels
Timer
Method
Prepare sugar solutions at a range of different solute concentrations
Use a cork borer to prepare a series of potato chips of the same length
Weigh each potato chip and record the initial mass
Place each potato chip into a solution at a different solute concentration and leave for a set period of time, e.g. 30 minutes
Remove the potato chips and dry them using a paper towel
Weigh each chip again and record the final mass
Calculate the change in mass of each chip


Analysing results
Calculate the percentage change in mass of each potato chip, remembering to indicate whether the mass increases or decreases
percentage change = (change in mass ÷ initial mass) x 100
Plot percentage change in mass against sugar concentration on a graph

Expected results
Water moves from high to low water concentration by osmosis, so we would expect that:
potato cylinders placed in pure water will gain mass
cylinders placed in a concentrated sugar solution will lose mass
For potato cylinders placed in a solution with a concentration that matches their cell contents, there will be little or no change in mass, as water movement into and out of the cells is balanced
On a graph that plots % change in mass against solute concentration, this is the point at which the line of best fit crosses the X axis
Examiner Tips and Tricks
There are other ways to investigate osmosis, so you may carry out an alternative practical, such as:
examining plasmolysed onion cells under a microscope
demonstrating mass change in eggs after the shell has been removed by soaking in vinegar

Unlock more, it's free!
Join the 100,000+ Students that ❤️ Save My Exams
the (exam) results speak for themselves:

Was this revision note helpful?