The Changing UK Population (Edexcel GCSE Citizenship Studies): Revision Note
Exam code: 1CS0

The UK's population today
The UK population is around 67 million people
This has increased steadily over the last 20–30 years due to longer life expectancy and migration
In the early 1990s, the population was closer to 57 million, showing significant growth over time
Gender balance
The population is roughly evenly split between males and females
Females slightly outnumber males overall
This is mainly because women tend to live longer than men
In older age groups, especially over 75, there are significantly more women than men
Where the population is concentrated
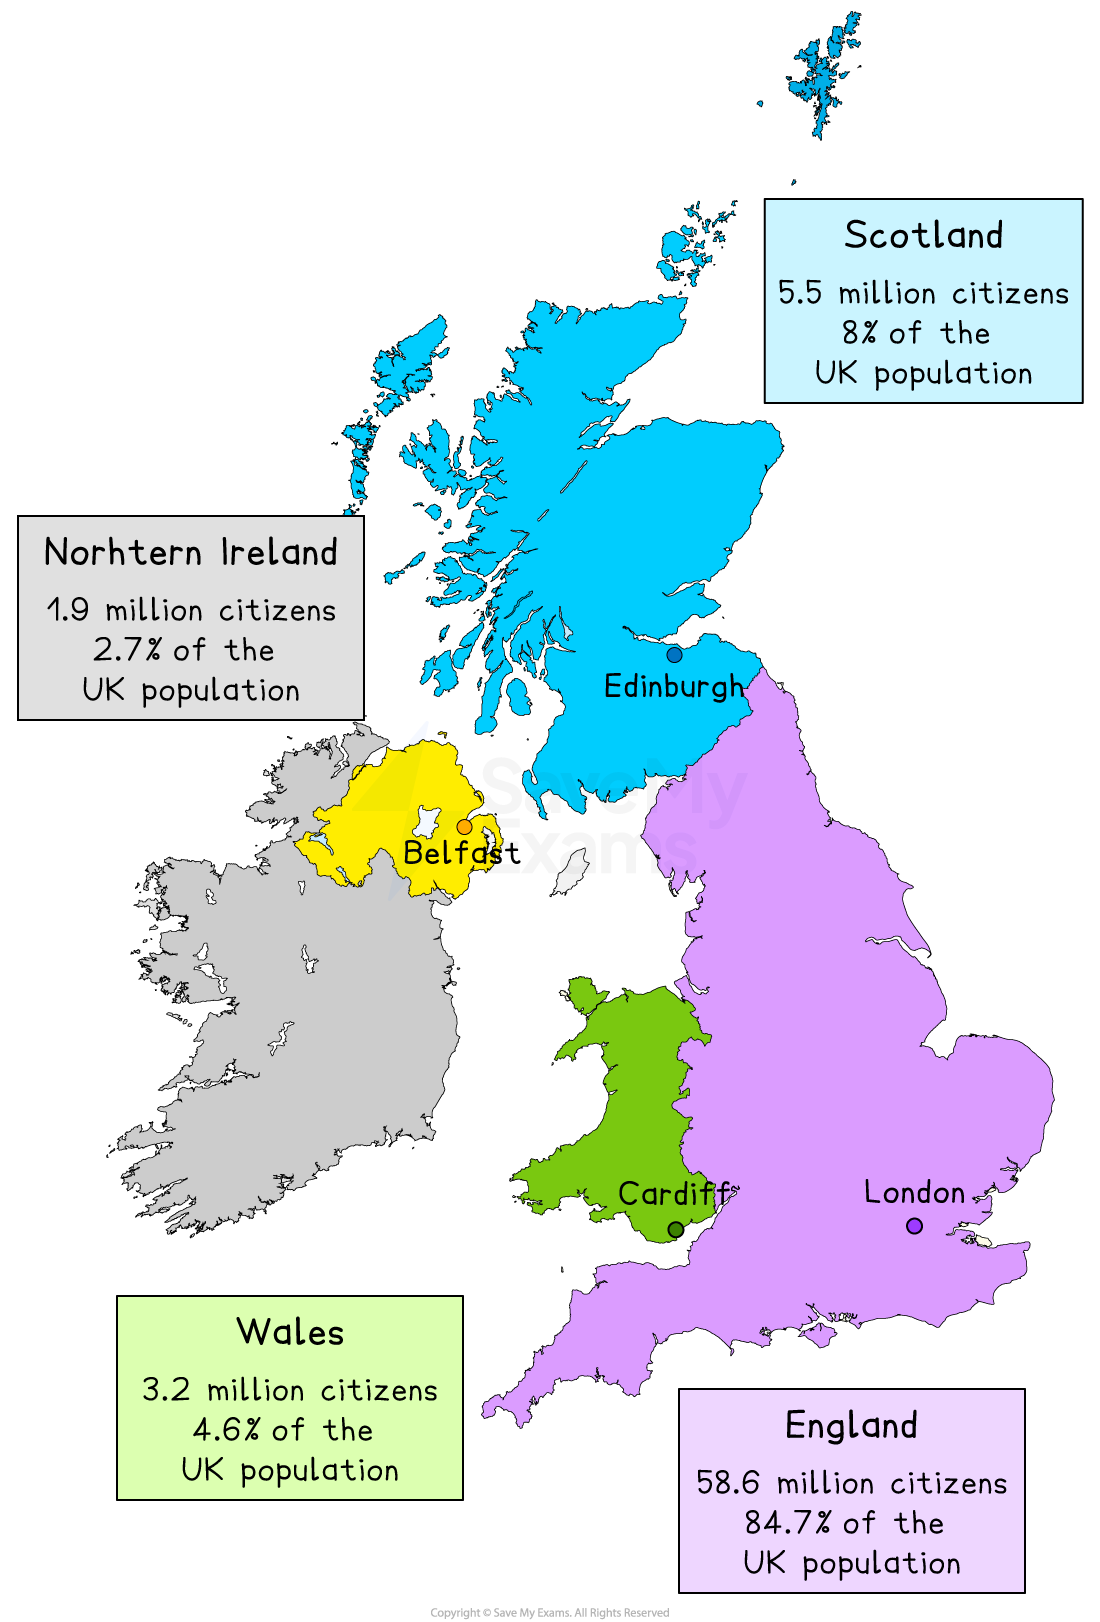
Population is unevenly distributed across the UK
England has by far the largest population
Scotland, Wales and Northern Ireland are much less densely populated
Most people live in urban areas
London is the most populated city and region
Other densely populated areas include the South East, West Midlands and North West
Rural areas tend to have:
Smaller populations
Older age profiles, as younger people often move to cities for work and education
Examiner Tips and Tricks
Link population changes to challenges and opportunities, such as pressure on services or benefits of diversity
An ageing population
People are living longer due to better healthcare and higher living standards
Life expectancy is around 79 years for men and 83 years for women
Improvements in medicine, vaccinations, housing, and nutrition have reduced early deaths
The number of people aged 65 and over has increased rapidly
Around 19% of the UK population is now aged 65+
This compares to about 15% in the early 1990s, showing clear growth over the last 30 years
Birth rates have generally fallen as families are having fewer children on average
Reasons include the cost of living, women having children later and greater access to contraception
Some primary schools have seen falling pupil numbers
The working-age population is growing more slowly
An ageing population puts pressure on public services
More demand for healthcare, especially the NHS
Greater spending needed for pensions and social care
Fewer workers paying tax to support an increasing retired population
The ageing population in the UK
Age group | Percentage of population | Key point |
|---|---|---|
0–15 | 18% |
|
16–64 | 63% |
|
65+ | 19% |
|
Ethnic and religious diversity in the UK
Ethnic diversity refers to the range of different ethnic groups and cultures living together in a society
Migration since the 1990s has increased ethnic diversity
Migration has come from EU countries, the Commonwealth and other parts of the world
People have migrated for work, education and safety
This has led to a wider mix of ethnic backgrounds across the UK
Cities have the highest levels of ethnic diversity
London is the most ethnically diverse part of the UK
Other large cities such as Birmingham, Manchester, Leeds, and Leicester also have high diversity
Rural and coastal areas tend to be less diverse
Ethnic diversity has increased significantly over time
In 1991, around 6% of the UK population was from an ethnic minority background
Today, this is around 18%, showing a major change over three decades
Increased diversity has contributed to cultural diversity
A wider range of languages, religions, food, music and traditions
Cultural festivals and events are more common in many communities
Communities, schools, and workplaces have changed
Schools often have pupils from many different ethnic backgrounds
Workplaces benefit from a wider range of skills and experiences
Communities are more multicultural, which can encourage tolerance and mutual respect
Ethnic diversity in the UK
Area | Ethnic minority population | Key point |
|---|---|---|
UK overall | 18% |
|
London | 40%+ |
|
Major cities | 20–35% |
|
Rural areas | Under 10% |
|
Religion and beliefs
Religious diversity means having a variety of different religions and beliefs practiced by people living in the same society
The UK is becoming more religiously diverse
Migration since the 1990s has increased the range of religions practised
Larger cities show the greatest religious diversity
Religious composition of the UK
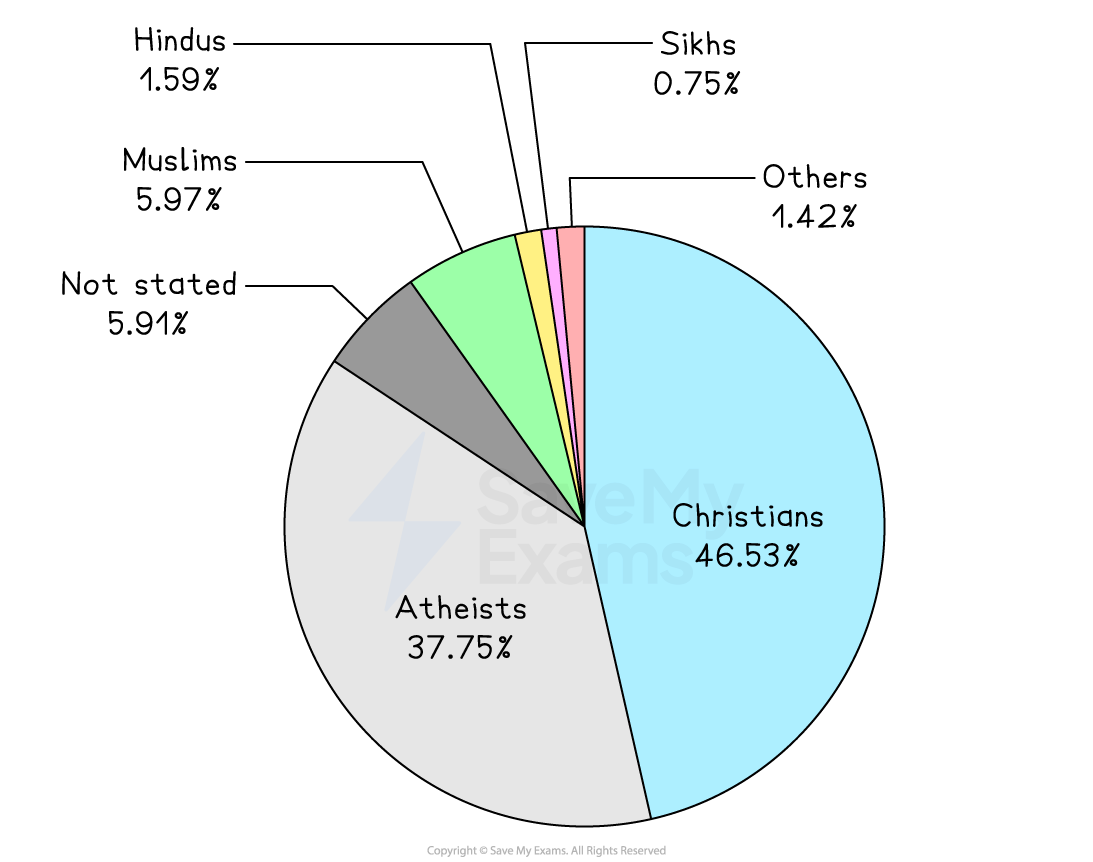
Christianity is still the largest religion, but it is declining
In 2001, about 72% of people identified as Christian
By 2021, this had fallen to around 47%
Fewer people regularly attend church compared to previous generations
There has been growth in non-Christian religions
Islam is the second largest religion at around 6% of the population
Hinduism, Sikhism, Judaism, and Buddhism have also grown
Growth is linked mainly to migration and higher birth rates in some communities
More people now say they have no religion
Around 38% of people identify as having no religion
This group has grown rapidly over the last 20 years
Beliefs vary by age and location
Younger people are more likely to say they have no religion
Urban areas tend to be more religiously diverse than rural areas
Disability and the UK population
The number of people living with a disability has increased over time
Around 1 in 5 people in the UK are disabled
This is partly because people are living longer, with increasing age-related disabilities
Disability is more common in older age groups
Many disabilities are linked to long-term health conditions
An ageing population means overall disability rates are rising
There is greater awareness and diagnosis of disability
Improved understanding of mental health and learning disabilities
More people are willing to identify as disabled than in the past
Disability affects daily life in different ways
Physical disabilities affect mobility or physical health
Mental health conditions are a growing part of disability statistics
Disabled people may face inequality and barriers
Barriers in education, employment, housing and transport
The Equality Act 2010 aims to protect disabled people from discrimination

Unlock more, it's free!
Join the 100,000+ Students that ❤️ Save My Exams
the (exam) results speak for themselves:

Was this revision note helpful?
