Reporting Experimental Work (SQA National 5 Chemistry): Revision Note
Exam code: X813 75

Labelled diagrams
A key skill is being able to draw a clear diagram of an experimental setup
A good scientific diagram is a simple 2D drawing with clear lines and labels
For more detail on specific apparatus, see the Common Chemical Apparatus revision note
Rules for a good diagram
Use a pencil and ruler for clear, straight lines
Draw in 2D cross-section
Label all important parts of the apparatus clearly
Make sure the apparatus is functional
For example, do not draw a sealed container if a gas needs to escape
Do not use shading

Examiner Tips and Tricks
Exam questions often use diagrams of experiments. There are two common question types you should be ready for:
Spot the mistake
You'll be shown a diagram with an error
You have to identify what's wrong with the setup
Name the apparatus
You'll be shown a diagram
You have to name the pieces of apparatus being used
Make sure you are familiar with the names and correct setup for common experiments like:
Results tables
Tables are the clearest way to present experimental data
A good table must have clear headings with units
Rules for a good results table
Use a ruler for neat columns and rows.
Every column must have a clear heading stating the quantity.
The units must be included in the heading (usually after a /).
Rates of reaction example results table
This table shows how the volume of a gas changes over time
Time / s | Volume of gas / cm3 |
|---|---|
0 | 0 |
10 | 34 |
20 | 56 |
30 | 72 |
A common exam question might ask you to plot this data on a graph
Titration example results table
This table shows the results from a titration experiment
Titration | Initial reading / cm3 | Final reading / cm3 | Titre / cm3 |
|---|---|---|---|
1 (Rough) | 0.00 | 11.00 | |
2 | 11.00 | 21.10 | |
3 | 22.00 | 32.60 | |
4 | 33.00 | 43.30 |
Common exam questions for this results table could be:
To calculate the titres
Titre = final volume - initial volume
To calculate the average titre, using only the concordant results
Concordant results are within 0.2 cm3
Graphs of results
Graphs are a powerful way to visualise trends in your data
It's important to choose the right type of graph for the data you have
Line graph or scatter graph
Use a line or scatter graph when you are plotting the relationship between two numerical sets of data
For example, plotting the volume of gas produced over time in a rates of reaction experiment

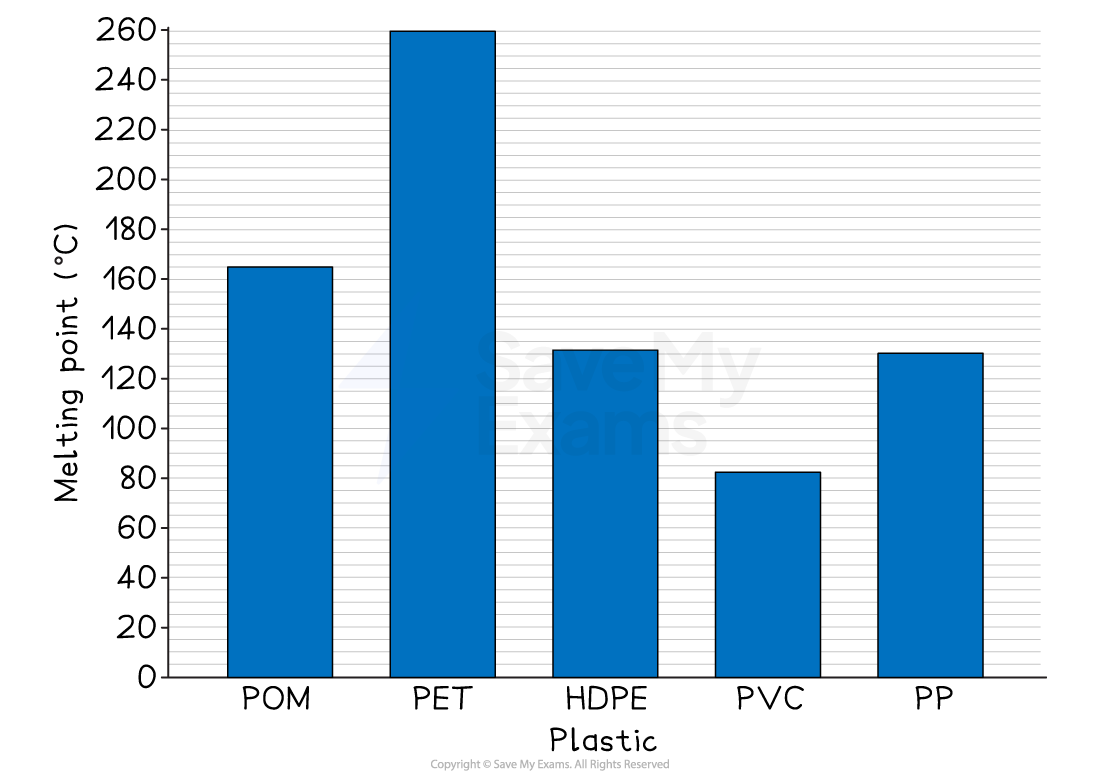
Bar chart
Use a bar chart when you are comparing data across different, non-numerical categories
For example, comparing the melting points of different named plastics like PVC, PET and HDPE
Rules for drawing a good graph
Drawing a graph correctly is a key skill that is often worth multiple marks in an exam
Follow this checklist:
Axes
Draw the independent variable on the x-axis
The independent variable is the one you control
For example, concentration of a reactant, mol l-1
Draw the dependent variable on the y-axis
The dependent variable is the one that you measure
For example, the volume of gas produced, cm3
Labels
Both axes must be fully labelled with the quantity and its units
For example, "Time / s"
Scale
Choose a simple, even scale for each axis
For example, going up in 2s, 5s or 10s
Your scale must be chosen so that your graph covers at least half of the available graph paper
Plotting
Plot your data points accurately using a sharp pencil
Use either neat crosses (x) or dots inside circles (⊙)
Line of best fit
Draw a single, smooth line of best fit
This can be a straight line or a smooth curve
Examiner Tips and Tricks
Drawing the line of best fit correctly is a key skill
Do NOT "join the dots" with a ruler
The line should show the overall trend of the points
It does NOT have to go through every single point
A good line of best fit will pass as close as possible to the points, with a roughly equal number of points above and below the line
Draw a single, confident line
Do not sketch or "feather" the line using multiple strokes
Calculating average (mean) values
Repeating an experiment and calculating an average (or mean) of your results is a key way to improve the reliability of your data
It helps to smooth out any small random errors made during the measurements
How to calculate an average
Identify your repeat readings for a particular measurement
Identify and discard any anomalous results
An anomalous result (or outlier) is a reading that does not fit the pattern of the others
Add the remaining, consistent readings together
Divide the total by the number of consistent readings you added
Examiner Tips and Tricks
When looking at a set of repeat readings, the anomalous result is the one that is clearly very different from the others. You should not include it when calculating the average
For example:
Results: 25.1 s, 25.3 s and 28.9 s
The anomalous result is 28.9 s
So, the average calculation is:
![]() = 25.2 s
= 25.2 s
Average titres
When calculating an average titre from a set of titration results:
You must only use the concordant results.
For SQA National 5, concordant results are titres that are within 0.2 cm3 of each other
The rough titre is always ignored
Worked Example
A student performed a titration and recorded their results in the table below.
Calculate the average titre that should be used for this experiment.
[1]
Titration | Titre / cm3 |
|---|---|
1 (Rough) | 21.80 |
2 | 21.30 |
3 | 21.20 |
4 | 22.10 |
Answer:
Identify the concordant results
Titres 2 and 3 are concordant results because they are within 0.1 cm3
This is within the 0.2 cm3 rule
The rough titre and Titre 3 are anomalous results to be discarded
Calculate the average of the concordant results
Average titre = ![]()
Average titre = 21.25 cm3 [1 mark]
Improving experiments
Exam questions often describe an experiment and ask you to suggest an improvement to the method
A good answer needs to be more than just a simple suggestion; it must be fully explained
Identify-improve-justify
To get full marks, your answer should have three parts:
Identify
State a specific weakness or source of error in the original method
Improve
Suggest a specific, practical change to the apparatus or procedure
Justify
Explain why your change is an improvement
Examples include:
To make the measurement more accurate
To reduce heat loss
To see the end-point more clearly
Common scenarios for improvement
Two of the most common experimental scenarios where improvements can be made are calorimetry and titrations
Calorimetry
Identify
A lot of heat energy is lost to the surroundings instead of heating the water
Improve
Use a lid on the beaker and place draught shields around the apparatus
Justify
This reduces heat loss, leading to a more accurate result
Titration
Identify
It can be difficult to see the exact point where the indicator changes colour
Improve
Place a white tile under the conical flask
Justify
This makes the colour change at the end-point much clearer and easier to see accurately
Worked Example
A student is investigating the rate of reaction between marble chips (calcium carbonate) and an acid. To measure the volume of acid, they pour approximately 50 cm3 into a beaker and then add it to the marble chips.
Suggest an improvement to the student's method for measuring the acid, and justify your answer.
[1]
Answer:
Identify
The student used a beaker, which is an inaccurate piece of apparatus for measuring a specific volume
Improve
They should use a measuring cylinder to measure the 50 cm3 of acid
Justify
This is an improvement because a measuring cylinder measures volume more accurately than a beaker
[1 mark for a valid improvement AND a correct justification]

Unlock more, it's free!
Join the 100,000+ Students that ❤️ Save My Exams
the (exam) results speak for themselves:

Was this revision note helpful?
