Paper 3: 10 Mark Synoptic Questions (AQA A Level Economics): Exam Questions

Exam code: 7136

1 hour8 questions
1
Sme Calculator
10 marks

To what extent, if at all, do the data suggest that houses in the UK were more  affordable in 2017 than they were in 2007?  You must use the data in Extract C to support your assessment.   

Case Study

Refer Insert (opens in a new tab)

Extract C: Selected indicators of the affordability of buying a house 

Figure 4

Average UK house price, average weekly earnings in nominal terms and their annual  percentage changes, December 2007 to December 2017 

Date

House Price

House price,   annual   percentage     change 

Weekly  earnings 

 Weekly  earnings, annual      percentage     change 

December 2007

£189 193 

7.0

£425

2.9

December 2008

December 2009

£160 954 

£168 082 

-14.9

4.4

 £435

 £439

2.4

0.9

December 2010

December 2011

£168 703

£167 048 

0.4

-1.0

 £449

 £457

2.2

1.8

December 2012

£168 843 

7.7

 £462

1.0

December 2013

December 2014

£177 971 

£191 669 

5.4

7.7

 £468

 £480

1.4

2.5

December 2015

December 2016

£204 919 

£215 500 

6.9

5.2

 £489

 £498

 1.9

1.9

December 2017

£226 756 

5.2

 £512

2.8

Source: ONS, February 2018 

2
Sme Calculator
10 marks

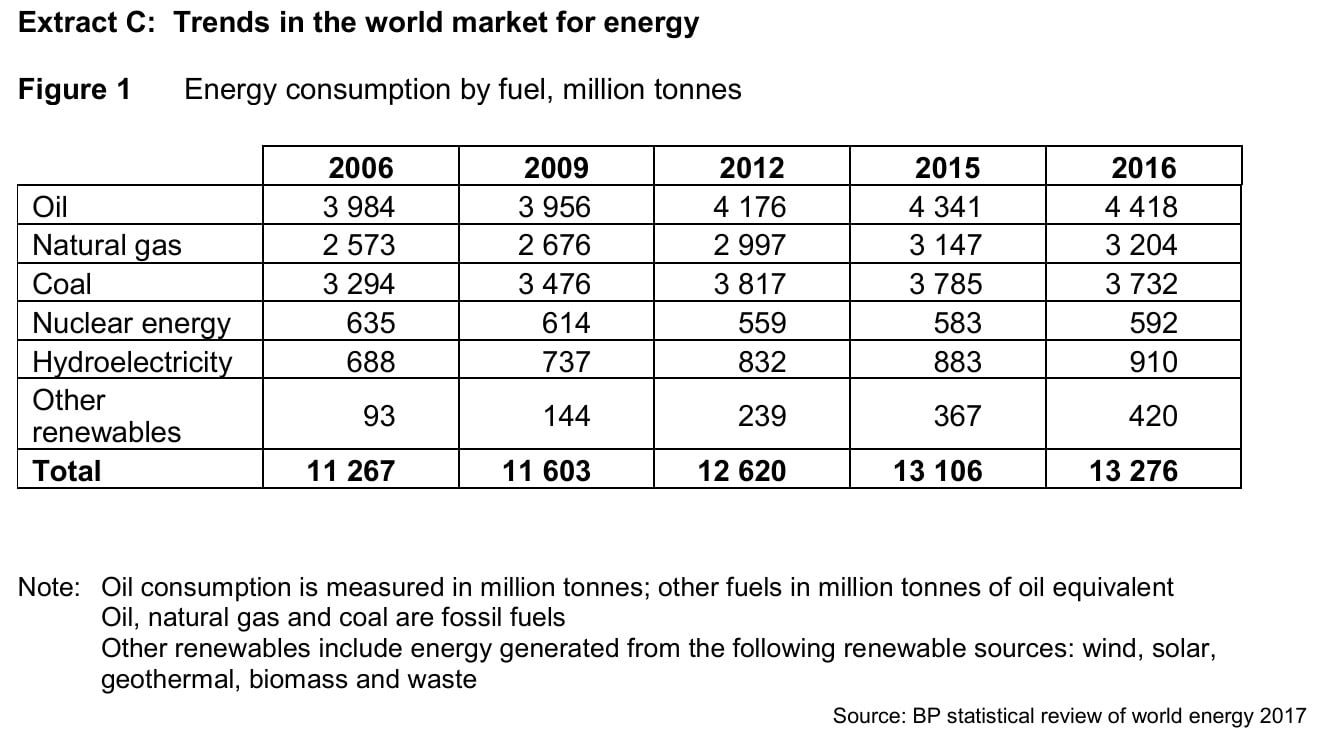
To what extent, if at all, do the data suggest that the reliance on fossil fuels to produce energy is falling?  You must use the data in Extract C to support your assessment 

Case Study

Refer Insert (opens in a new tab)

Table showing global energy consumption by fuel type from 2006 to 2016 in million tonnes, detailing oil, natural gas, coal, nuclear, hydro, and other renewables.
3
Sme Calculator
10 marks

To what extent, if at all, does the data suggest that living standards in the UK improved between 2007 and 2017? You must use the data in Extract B to support your assessment

Case Study

Refer Insert (opens in a new tab)

Extract B

insert---extract-b-paper-3-june-2020-aqa-a-level-economics

Figure 2: Income inequality

insert---figure-2-paper-3-june-2020-aqa-a-level-economics

Figure 3: Homelessness

insert---figure-3-paper-3-june-2020-aqa-a-level-economics
4
Sme Calculator
10 marks

To what extent, if at all, do you consider that the UK manufacturing sector has been in decline since 2003? You must use the data in Extract B to support your assessment

Full insert (opens in a new tab) here

Case Study

Extract B:       Trends in UK manufacturing 

Figure 1: Index of manufacturing output 2003 to 2015, 1997 = 100

insert---extract-b---fig-1-paper-3-june-2017-aqa-a-level-economics

 Figure 2: Manufacturing employment Jan–Mar 2003 to Oct–Dec 2015, thousands

insert---extract-b---fig-2-paper-3-june-2017-aqa-a-level-economics

Figure 3: Value of UK trade in goods 2003 to 2015, £ billion at current prices  

Year

Exports

Imports

Balance

2003

188.5

239.5

–51.0

2004

191.6

253.5

–61.9

2005

212.1

282.2

–70.1

2006

244.0

322.9

–78.9

2007

223.0

313.5

–90.5

2008

254.6

349.6

–95.0

2009

229.1

315.7

–86.6

2010

270.2

367.6

–97.4

2011

308.2

401.7

–93.5

2012

304.3

410.8

–106.5

2013

306.2

421.5

–115.3

2014

293.7

416.9

–123.2

2015

285.6

410.7

–125.1

  Figure 4: Annual average rate of growth in UK manufacturing output and real GDP, 1949 to 2015  


Years

Average rate of growth of UK manufacturing (%)

Average rate of growth of UK real GDP (%)

1949 – 1973

3.4

3.4

1974 – 1992

0.1

1.9

1993 – 2007

0.9

3.0

2008

–2.8

–0.5

2009

–9.4

–4.2

2010 – 2015

1.1

2.0

 Source: Official statistics for all data in Extract B

510 marks

Referring to the Insert (opens in a new tab), study Extracts A, B and C, then use these and your knowledge of economics to help you answer the question

To what extent, if at all, do the data suggest that people living in the South East (SE) of England are better off than people living in the North East (NE) of England?

610 marks

Study Extracts A, B and C, then use these and your knowledge of economics to help you answer the question:

To what extent, if at all, do the data suggest that the Sri Lankan economy is more economically developed than the economies of Bangladesh and Pakistan?

Case Study

Refer to the Insert (opens in a new tab)

710 marks

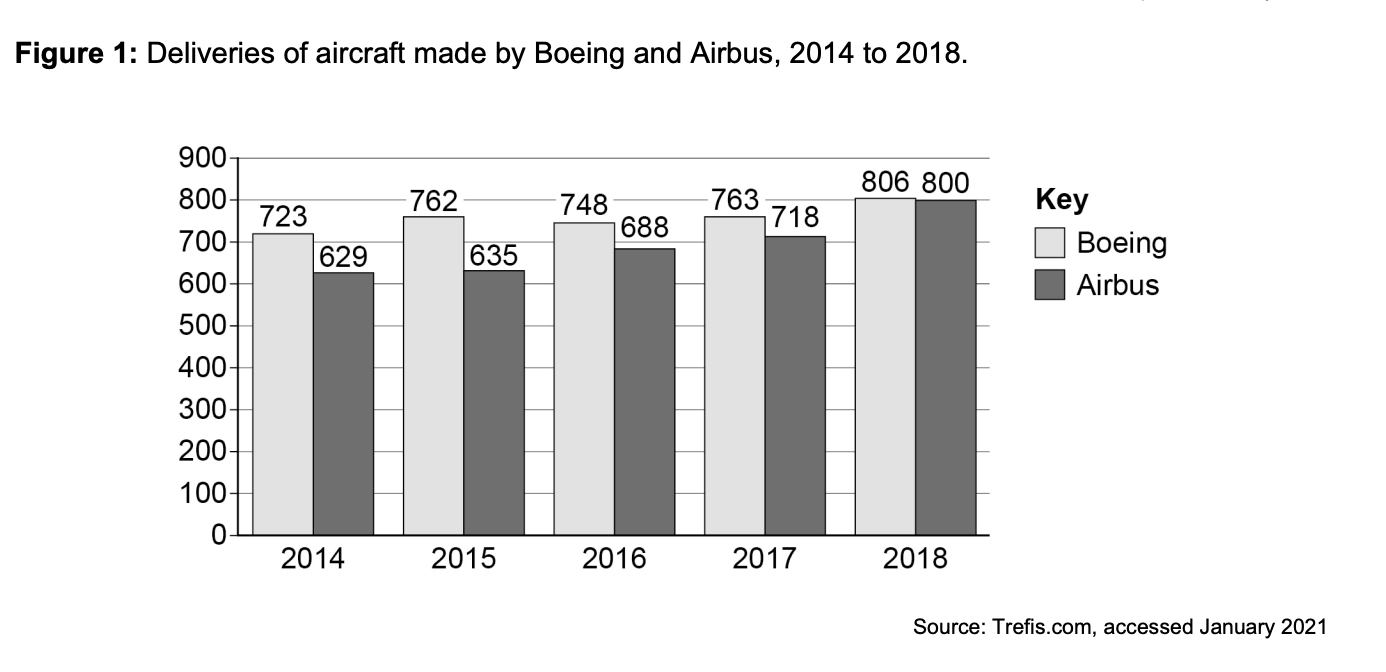
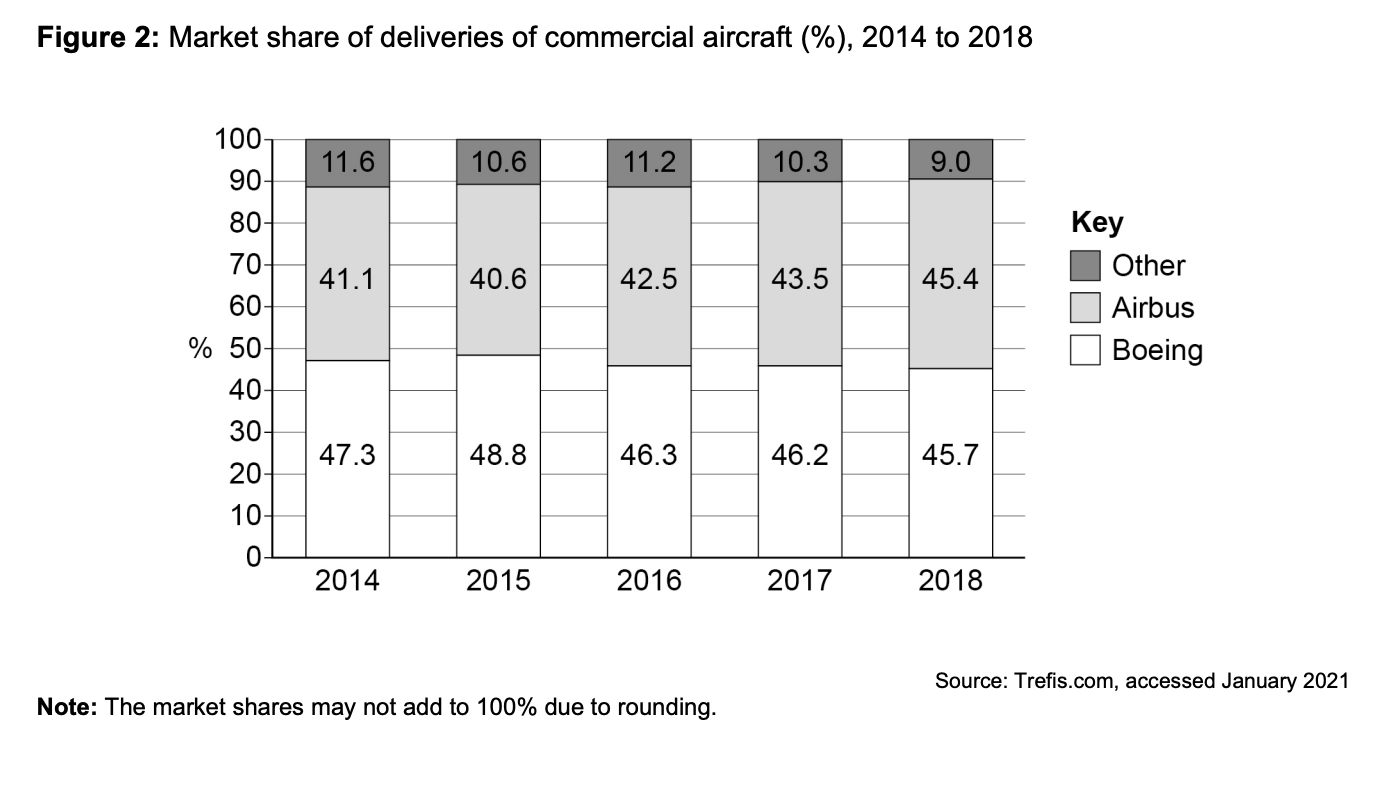
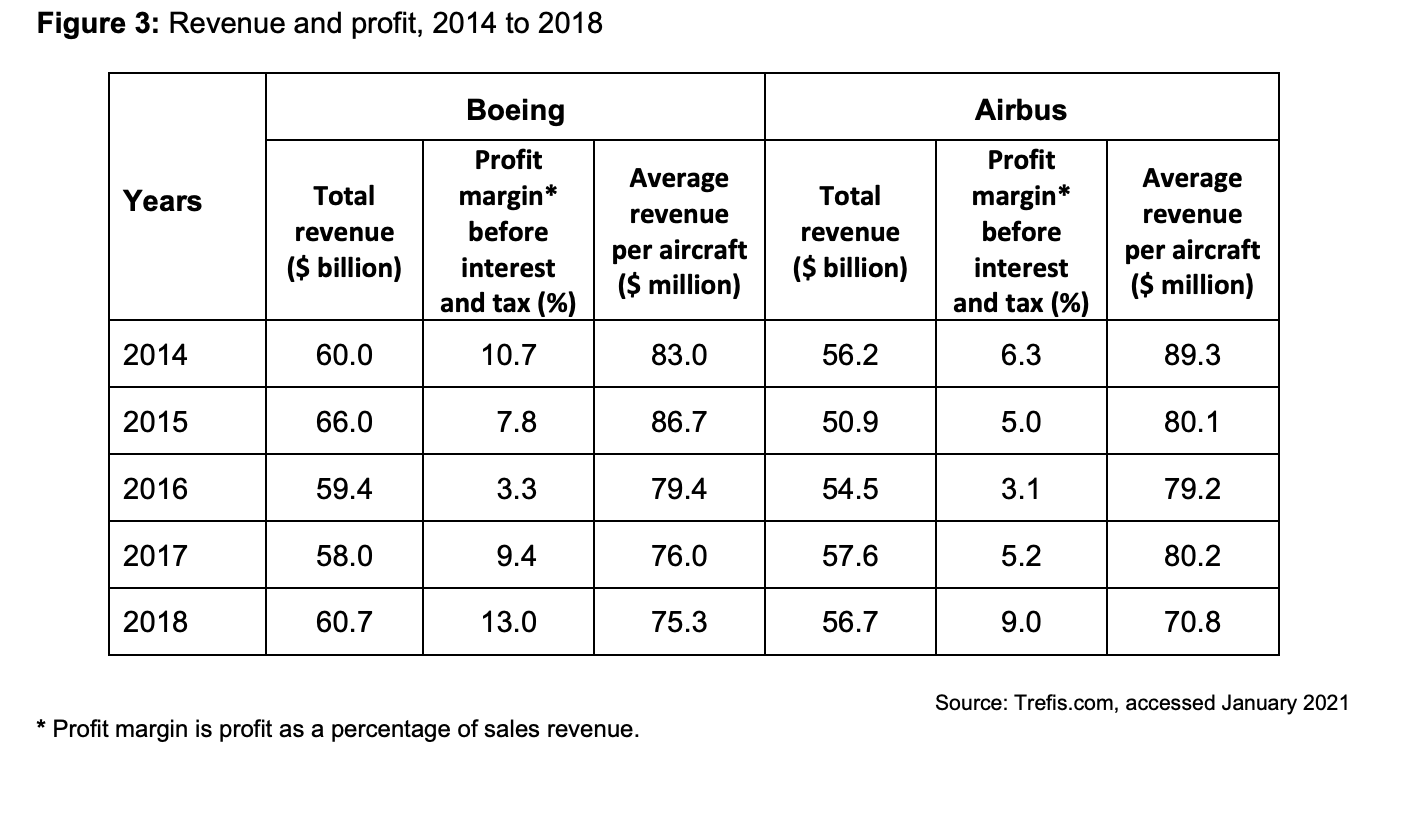
To what extent do the data support the view that Boeing has been more successful than Airbus since 2014? You must use the data in Extract B to support your assessment

Insert (opens in a new tab)

Case Study

Extract B: Selected indicators of the performance of Boeing and Airbus

In 2018, Boeing and Airbus each delivered around 800 aircraft. Boeing had a backlog of orders for 5488 aircraft and Airbus had 7133 orders outstanding. In 2019, Airbus delivered 863 aircraft but Boeing’s deliveries fell to 380 because the Boeing 737 MAX aircraft was grounded due to safety concerns. Towards the end of 2020, regulators in Europe and the USA ruled that design changes would mean that the plane is now safe to fly.

Source: News reports, January 2021

Bar chart showing aircraft deliveries by Boeing and Airbus from 2014-2018. Boeing's numbers are consistently higher, peaking in 2018.
Bar chart of aircraft delivery market share (2014-2018) with Airbus, Boeing, and Others. Airbus leads, Others decrease, Boeing fluctuates.
Table comparing Boeing and Airbus revenue, profit margin, and average revenue per aircraft from 2014 to 2018.
810 marks

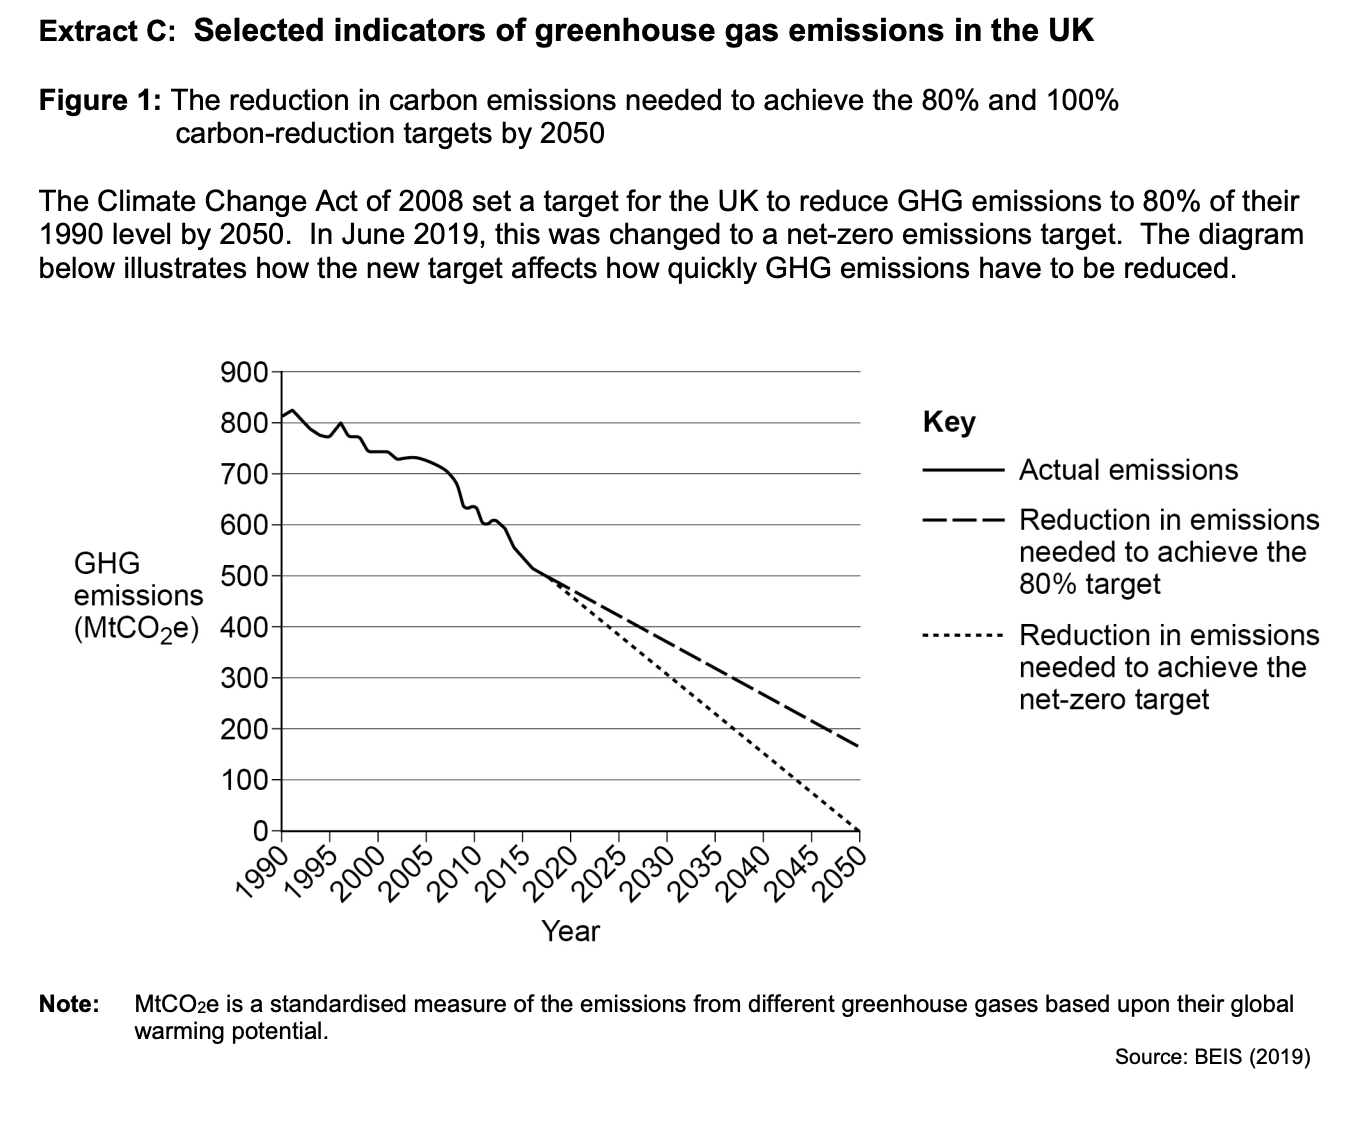
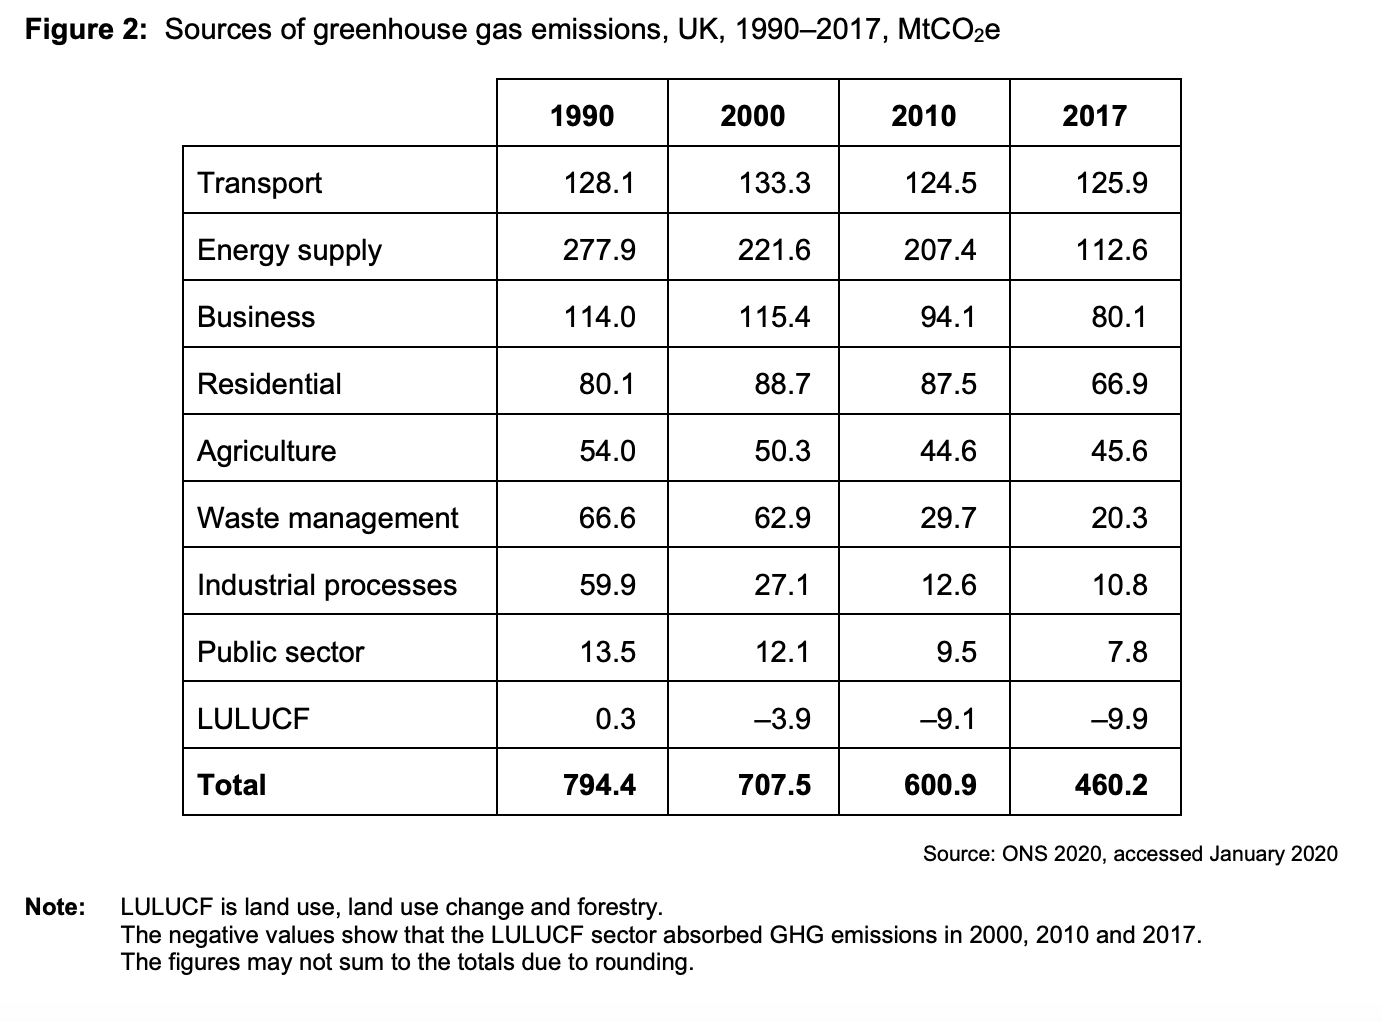
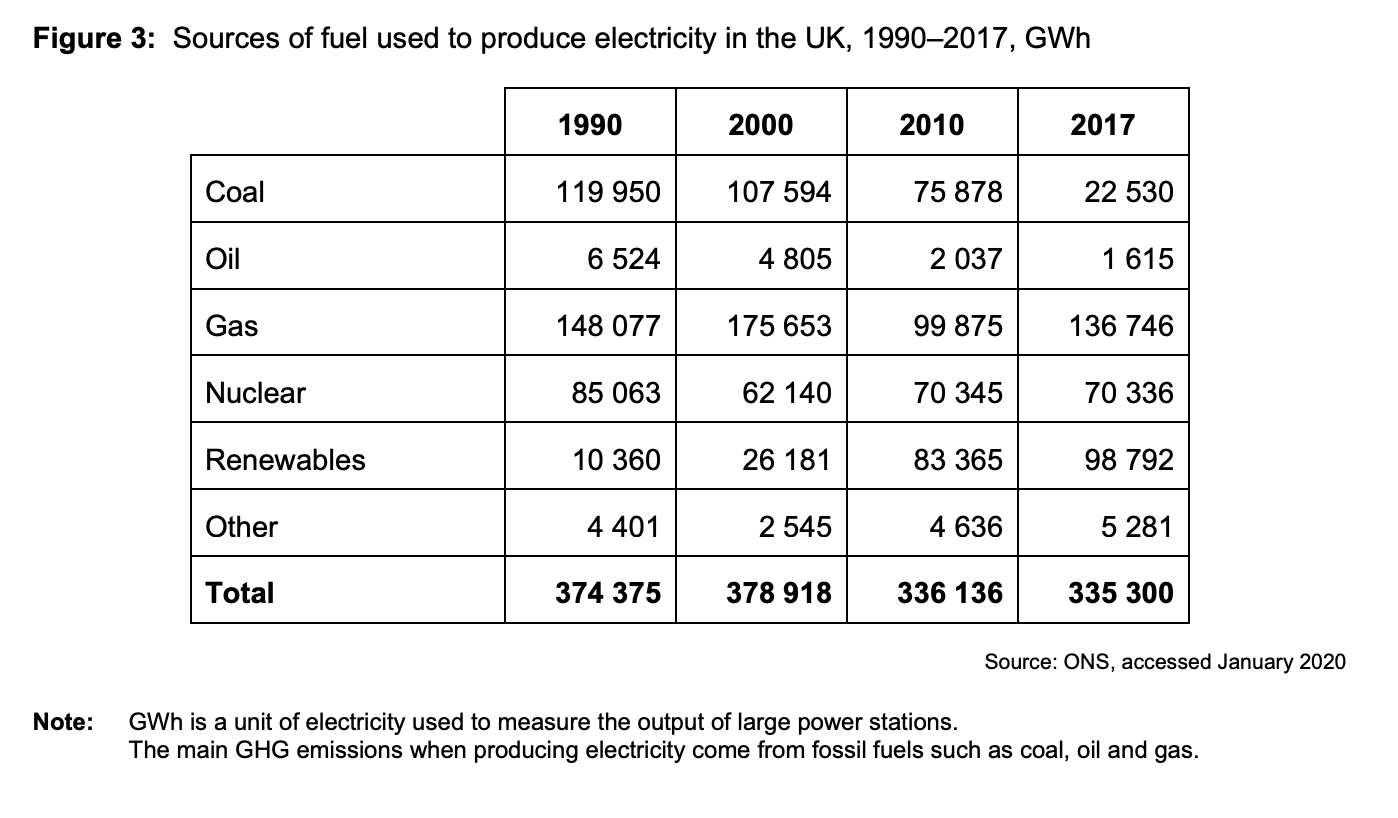
The UK government has set a target to reduce net greenhouse gas (GHG) emissions to zero by 2050.

To what extent, if at all, do the data suggest that to achieve its net-zero emissions target, the government should focus on reducing GHG emissions from the transport sector? You must use the data in Extract C to support your assessment.

Insert (opens in a new tab)

Case Study

extract c
FIGURE 2
Figure 3