Economic Methodology & the Economic Problem (AQA A Level Economics): Exam Questions

Exam code: 7136

25 mins11 questions
1
Sme Calculator
1 mark

Economics is a social science because

  • all economic hypotheses are based on value judgements.

  • economic policies can only be based on positive analysis.

  • it involves the study of human behaviour and economic decision making.

  • quantitative data cannot be used to test economic theories.

2
Sme Calculator
1 mark

The table below shows the value of the Gini coefficient for a country between 2012 and 2016.   Over the five year period, the government has used progressive taxation to change the distribution of income. 

Year

Gini coefficient

2012

0.60

2013

0.55

2014

0.50

2015

0.45

2016

0.40

Based on the above data, which one of the following is a positive statement? 

  • A progressive tax system is the fairest way of correcting income inequality. 

  • Between 2012 and 2016 the distribution of income in the country became more equal. 

  • The Gini coefficient is the best way of measuring changes in the distribution of income. 

  • The government should continue to tax the rich to improve the distribution of income. 

3
Sme Calculator
1 mark

The diagram below shows the production possibility frontier for an economy that produces consumer goods and capital goods. The economy is initially operating at point X within its frontier.

q3-paper-3-june-2018-aqa-a-level-economics

If the economy now moves from point X to point Y on its frontier it will

  • achieve both productive and allocative efficiency.

  • benefit from improved economies of scale in the production of both goods.

  • increase its underlying trend rate of growth.

  • obtain more consumer goods and capital goods at zero opportunity cost.

4
Sme Calculator
1 mark

Economic decision making and policies are influenced by value judgements because

  • all people are motivated by the desire to maximise their incomes

  • economic analysis and decision making is assumed to be based on complete information.

  • they are based on the same methodology as the natural sciences.

  • they involve moral and political considerations as well as positive analysis.

51 mark

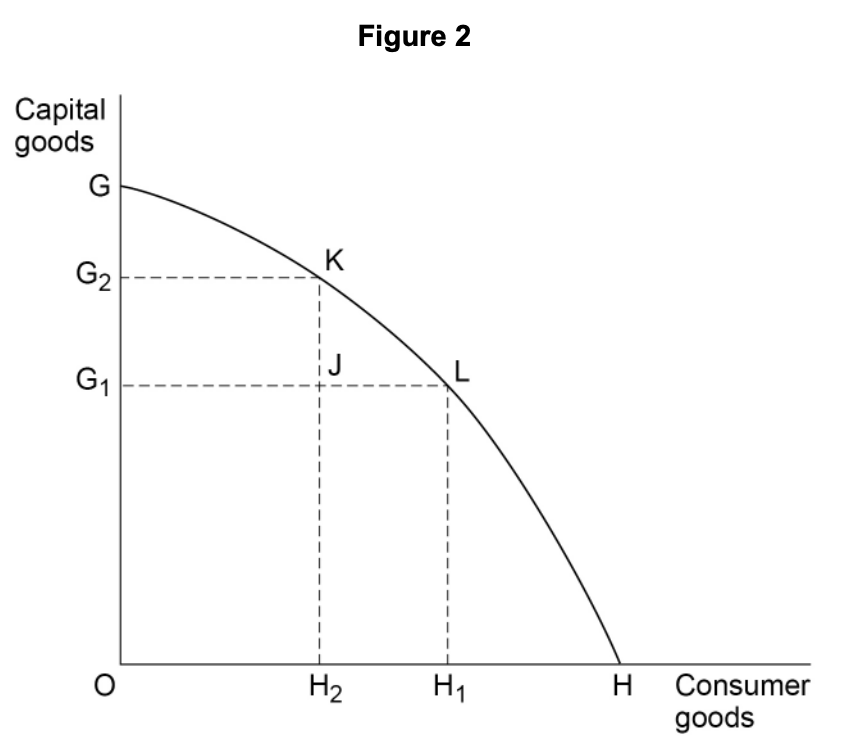
Figure 2 shows the production possibility curve for an economy producing capital and consumer goods.

Graph showing a production possibility curve for capital and consumer goods. Points K, J, L on the curve illustrate different output levels. Axes are labelled.

The opportunity cost of increasing the output of capital goods from G1 to G2 is shown by

  • H - H2

  • H2KLH1

  • G2 - G1

  • H1 - H2

61 mark

A positive statement

  • does not take into account irrational behaviour.

  • enables accurate forecasts to be made.

  • includes a value judgement.

  • may be true or false.

71 mark

The environment is a scarce resource. A consequence of this is that

  • all natural resources have a market price.

  • all natural resources will eventually be used up.

  • the environment has an opportunity cost.

  • the environment is a pure public good.

81 mark

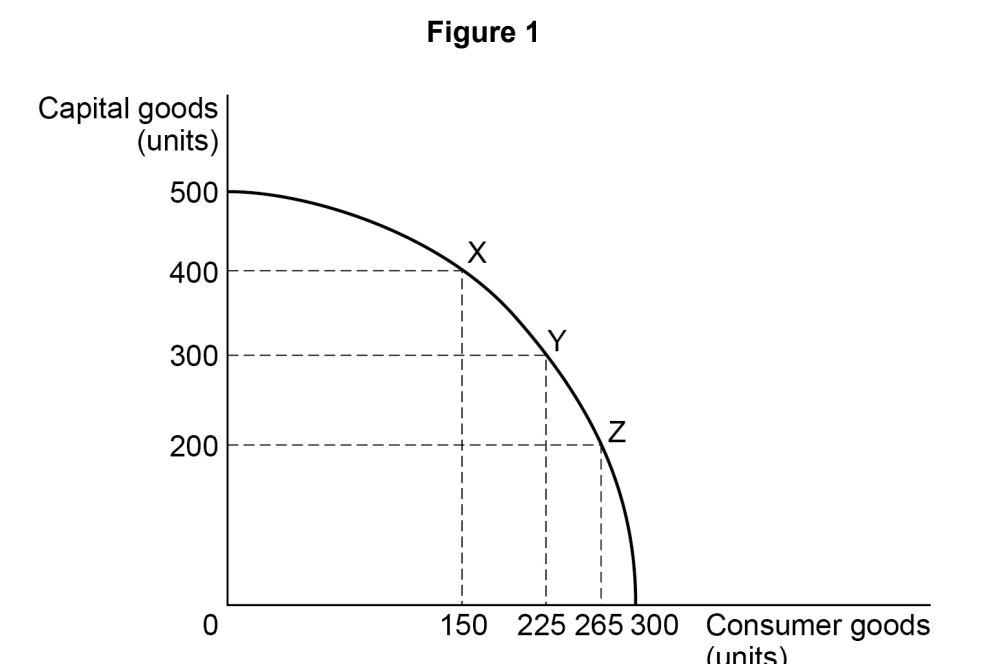
Figure 1 shows the production possibility diagram for an economy producing capital goods and consumer goods.

Graph showing a production possibility curve with capital goods on the Y-axis and consumer goods on the X-axis, with points X, Y, Z marked.

The opportunity cost of producing an additional unit of capital goods is

  • greater at X than Y.

  • greater at Z than Y.

  • the same at X, Y and Z.

  • zero when 300 units of consumer goods are produced.

91 mark

Which one of the following is a consequence of the basic economic problem of limited resources and unlimited wants?

  • All goods and services will have a market price

  • Employment of factors of production has an opportunity cost

  • Markets are unable to allocate resources efficiently

  • There will not be an excess supply in markets

101 mark

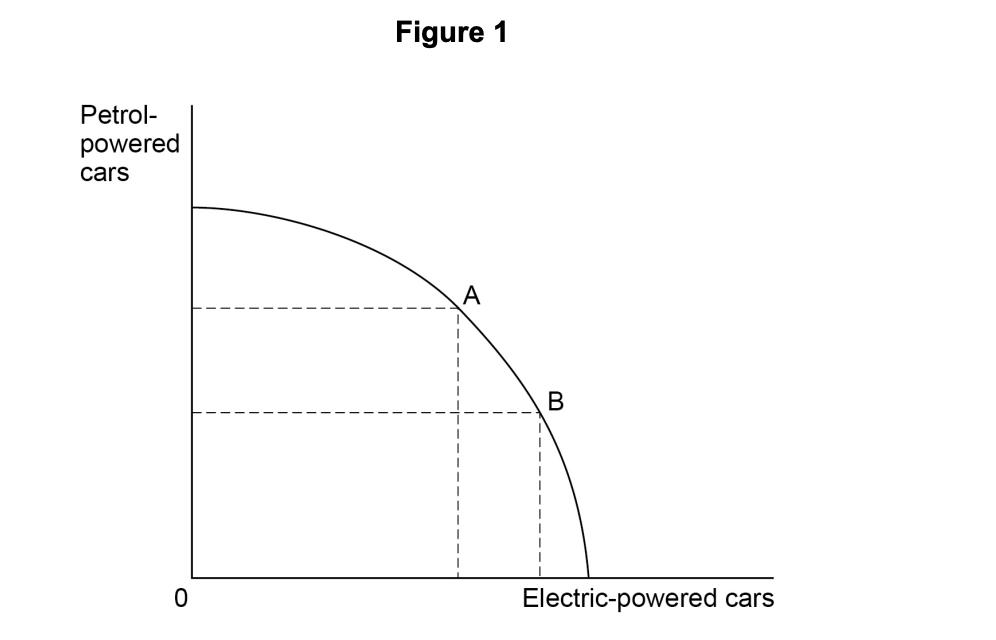
Figure 1 shows the production possibility boundary for petrol-powered cars and electricpowered cars in a country's car industry

Graph showing a curve with points A and B, comparing quantities of petrol-powered cars and electric-powered cars. Axes are labelled with zero origin.

If production has moved from Point A to Point B, which one of the following must be true?

  • Allocative efficiency in the car industry is unchanged

  • Demand for electric-powered vehicles has increased

  • Productive efficiency in the car industry is unchanged

  • Static efficiency in the car industry has improved