Price Determination in Competitive Markets (AQA A Level Economics): Exam Questions

Exam code: 7136

31 mins23 questions
1
Sme Calculator
1 mark

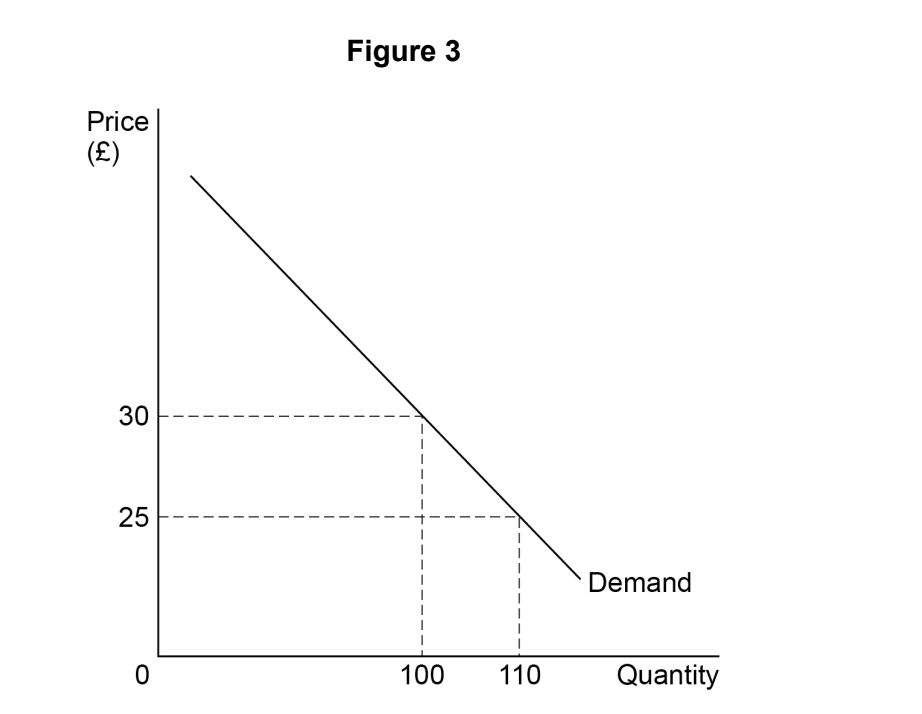
Figure 4 shows a firm’s demand (D) curve and its marginal revenue (MR) curve for good X. The firm initially sells OQ1 units of X per day at a price of OP1.

Figure 4

q15-paper-3-june-2020-aqa-a-level-economics

If the firm increases its price by 10%

  • price elasticity of demand will decrease.

  • price elasticity of demand will not change.

  • total revenue will decrease.

  • total revenue will increase.

2
Sme Calculator
1 mark

Table 3 shows the demand for and supply of oranges at a range of prices between 10 pence and 30 pence.

Table 3


Price (pence)

Quantity

supplied (000s)

Quantity

demanded (000s)

10

100

125

15

120

120

20

122

108

25

125

100

30

128

88

As a result of an increase in consumers’ incomes, the demand for oranges increases by 25% at each of the prices shown in Table 3.

After the rise in incomes:

  • at a price of 10 pence, excess demand increases by 50%.

  • at a price of 30 pence, excess supply falls by 75%

  • the equilibrium market price increases by two-thirds

  • the price elasticity of demand increases by 25% at each price.

3
Sme Calculator
1 mark

All other things being equal, the demand for labour is more likely to be wage elastic if

  • it is difficult to substitute capital for labour.

  • the cost of labour is a low percentage of total costs.

  • the final product has a high price elasticity of demand.

  • the supply curve for labour is wage elastic.

4
Sme Calculator
1 mark

The diagram below shows the market demand (D) curve and two supply (S1 and S2) curves for a brand of soft drink. The drink is a demerit good because of its high sugar content. The government imposes an indirect tax on each can sold that cuts consumption by 100 000 cans per week.

q6-paper-3-june-2019-aqa-a-level-economics

If the price elasticity of demand for the drink is –2.0, the price must have increased by

  • 5p

  • 10p

  • 15p

  • 20p

5
Sme Calculator
1 mark

Beef and leather are in joint supply. Changes in farming methods have resulted in a significant fall in the price of chicken, a substitute for beef. All other things being equal, which one of the following diagrams, A, B, C, or D, best illustrates the effects of the fall in the price of chicken on the market for leather?

q22-paper-3-june-2019-aqa-a-level-economics
    6
    Sme Calculator
    1 mark

    The diagram below shows two market demand curves (D1 and D2) and the market supply curve (S), for Good X.

    q29-paper-3-june-2019-aqa-a-level-economics

    The price elasticity of supply of Good X when the demand curve shifts from D1 to D2 is

    • +0.25

    • +2.0

    • +4.0

    • +7.5

    7
    Sme Calculator
    1 mark

    At the initial market equilibrium, the income elasticity of demand for fresh chickens is +1.5, and the price elasticity of supply is +1.0. Then there is a 5% increase in consumers’ income.

    Which one of the following combinations, A, B, C or D, is most likely to show the changes in the market equilibrium price and quantity?


    Price

    Quantity

    A

    Higher

    Unchanged

    B

    Higher

    Higher

    C

    Unchanged

    Unchanged

    D

    Lower

    Higher

      8
      Sme Calculator
      1 mark

      The diagram below shows the demand curves (D1 and D2) and the supply curve (S) in the market for good X. The initial market equilibrium is at E1.  

      screen-shot-2023-06-05-at-8-52-35-am

      The increase in market demand from D1 to D2 results in a new market equilibrium at E2. The market mechanism that leads to the establishment of the new equilibrium is based on

      • excess demand for good X at the initial price of P1.

      • excess demand for good X at the new price P2.

      • excess supply of good X at the initial price of P1.

      • excess supply for good X at the new price P2.

      9
      Sme Calculator
      1 mark

      The price elasticity of demand for games consoles is -1.2. It can be concluded that a 10% reduction in their price would lead to a percentage change in demand of

      • -8.3%

      • -12.0%

      • +8.3%

      • +12.0%

      10
      Sme Calculator
      1 mark

      The price of good Y, a substitute for good X, rises from 75p to £1. As a result, the quantity of demand for good X rises from 3 million units to 5 million units per month.

      What is the value of the cross elasticity of demand for good X with respect to good Y?

      • +0.5

      • –0.5

      • +2.0

      • –2.0

      111 mark

      Figure 8 shows two demand (D1 and D2) curves and two supply (S1 and S2) curves in the market for tea

      Supply and demand graph showing shifts; supply lines S1, S2, demand lines D1, D2. Equilibriums at E1, E2. Prices P1, P2; quantities Q1, Q2 noted.

      Tea and coffee are substitutes. All other things being equal, which one of the following is the most likely explanation of the move from E1 to E2 in the market for tea?

      • A fall in the price of tea and a rise in productivity in coffee production

      • A rise in the price of coffee and an increase in the cost of producing tea

      • An increase in competition in the market for tea and a fall in the price of coffee

      • The removal of a subsidy to tea producers and a fall in the price of coffee

      121 mark

      Figure 1 shows the demand for lemons.

      Demand curve graph labelled 'Figure 1' with axes for Price and Quantity showing points P1, P2, and Q1, Q2 along a downward-sloping line D.

      The fall in price and increase in the quantity demanded of lemons could have been caused by

      • a fall in the price of a substitute for lemons, oranges.

      • a rise in the price of lemonade.

      • a reduction in the price of a complement for lemons, fish.

      • favourable weather leading to a record harvest.

      131 mark

      Carrots and potatoes are grown using the same factors of production. Figure X shows the demand (DC) and supply (SC) curves for carrots. Figure Y shows the demand (DP) and supply (SP) curves for potatoes. A change in people’s preferences shifts the demand for carrots from DC1 to DC2. As a result, the supply of potatoes shifts from SP1 to SP2.

      Graphs showing supply and demand for carrots and potatoes. Carrot demand shifts right; potato supply shifts right. Price and quantity axes included.

      Which one of the following statements correctly explains the changes shown in Figures X and Y?

      • The demand curve for carrots shifts due to the rationing function of prices

      • The price of carrots increases because carrots and potatoes are in derived demand

      • The price of potatoes increases because potatoes and carrots are in joint supply

      • The supply curve for potatoes shifts due to the incentive function of prices

      141 mark

      Table 1 shows the price of a packet of peanuts and the number of packets of cashew nuts sold in a shop in one month. The price of a packet of cashew nuts is unchanged.

      Table 1

      Price of a packet of peanuts

      Number of packets of cashew nuts purchased per month

      £0.80

      20 000

      £0.84

      32 500

      When the price of a packet of peanuts rises from £0.80 to £0.84, the cross elasticity of demand for cashew nuts with respect to the price of peanuts is

      • –12.5

      • –0.08

      • +0.08

      • +12.5

      151 mark

      Figure 3 shows the demand curve (Demand) and the supply curve (Supply) for bus travel within a city. The initial market equilibrium price is P.

      Supply and demand graph with price on the vertical axis and quantity on the horizontal. Intersection at point H, with equilibrium price P and quantity Q.

      To reduce pollution, the city council pays bus companies to provide bus travel free of charge. As a result of this policy, consumer surplus will increase by the area

      • OFHJ

      • FGH

      • OPHJ

      • QHJ

      161 mark

      Figure 3 shows the demand curve for a firm’s scarves.

      Graph showing a downward-sloping demand line with price (30 to 25) on the y-axis and quantity (100 to 110) on the x-axis, labelled "Figure 3".

      Which one of the following statements is true when the price of scarves is reduced from £30 to £25?

      • Demand for scarves is price elastic.

      • Price elasticity of demand is –0.5.

      • The firm’s total revenue falls.

      • The firm’s total revenue increases.

      171 mark

      Which one of the following is a reason why the supply of cars is likely to be price elastic in the short run when the price of cars increases?

      • Car manufacturers’ stocks of unsold cars are low

      • The demand for cars is also price elastic

      • The marginal cost of producing cars increases significantly with output

      • There is considerable spare capacity in the car industry

      181 mark

      A household's annual income increases from £35 000 to £38 500. All other things being equal, if the household's income elasticity of demand for Good X is –0.2 and its income elasticity of demand for Good Y is 0.4, which one of the following statements is correct?

      • Spending on Good X will fall by £70 and spending on Good Y will increase by £140

      • Spending on Good X will fall by £700 and spending on Good Y will increase by £1400

      • The firm may have to recruit the worker from the local area because labour is often geographically immobile

      • The firm is unlikely to know everything about job applicant’s skills, abilities and motivation

      191 mark

      Figure 3 shows how the markets for Good X and Good Y are affected by an increase in the demand for Good X

      Two supply and demand graphs for Goods X and Y showing shifts in curves. Good X: demand increase. Good Y: supply decrease. Axes labelled price and quantity.

      It can be concluded that Good X and Good Y are in

      • competitive demand.

      • composite demand.

      • derived demand.

      • joint supply