The Labour Market (AQA A Level Economics): Exam Questions

Exam code: 7136

1 hour22 questions
1
Sme Calculator
1 mark

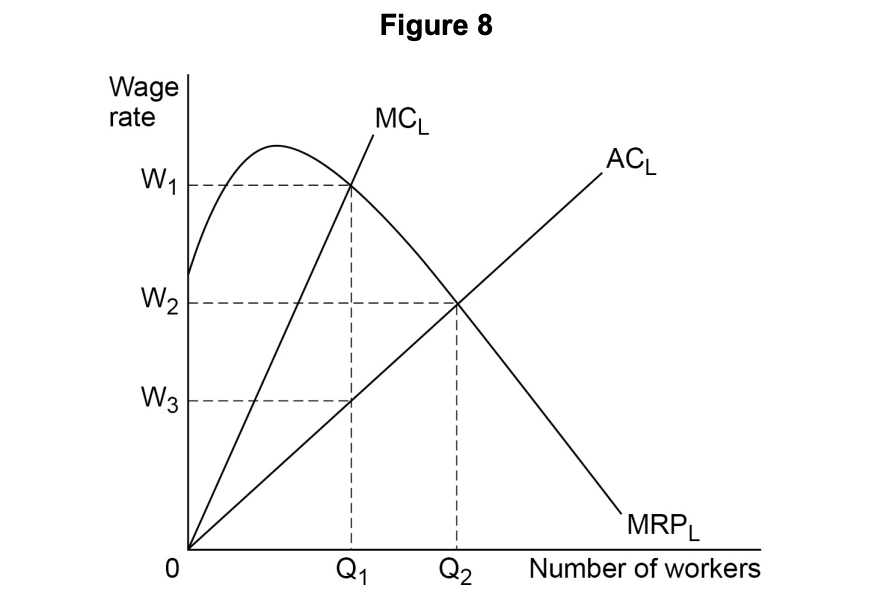
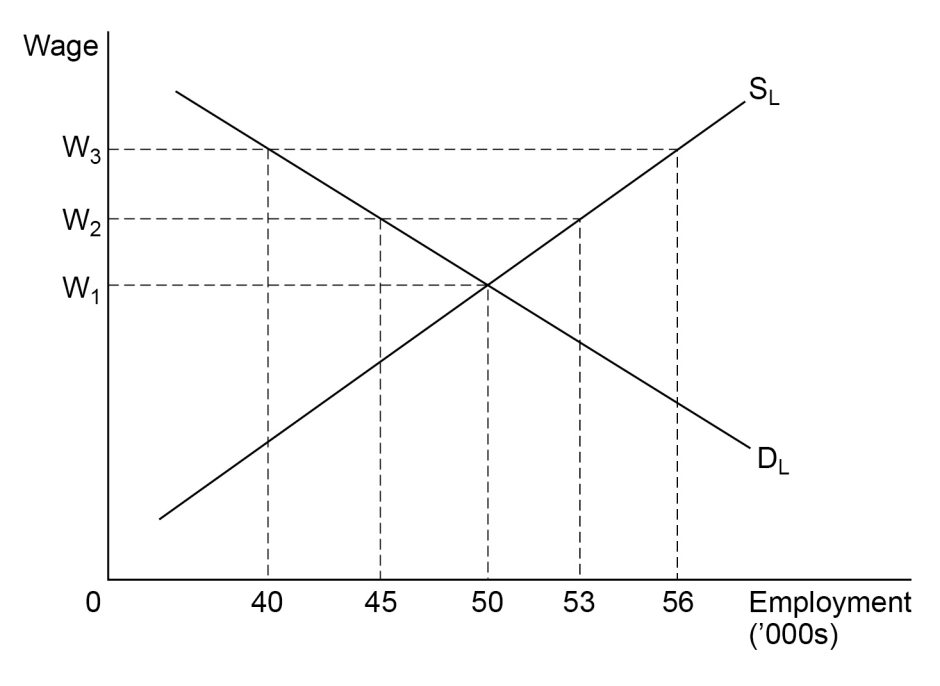
Figure 5 shows the market demand for labour (DL = MRPL), the market supply of labour (SL=ACL), and the marginal cost of labour (MCL), in a particular industry. The employer in this industry is a monopsonist.    

q20-paper-3-june-2020-aqa-a-level-economics


  From Figure 5, it can be concluded that, in the absence of a trade union or a minimum wage, the firm will employ                         

  • OQ1 workers at a wage of OW1.

  • OQ2 workers at a wage of OW1.

  • OQ2 workers at a wage of OW2.

  • OQ2 workers at a wage of OW3.

2
Sme Calculator
1 mark

All other things being equal, which one of the following is most likely to cause the marginal revenue product of labour curve in the shoe manufacturing industry to shift to the right?

  • A decrease in money wage rates in the shoe industry.

  • A decrease in the number of workers employed in the shoe industry.

  • An increase in the market demand for shoes.

  • An increase in the number of firms competing in the shoe industry.

3
Sme Calculator
1 mark

The diagram below shows the demand and supply curves for skilled labour (Ds and Ss) and unskilled labour (Du and Su) and the wage differential (Ws–Wu) between the two types of labour.

q27-june-2018-aqa-a-level-economics


All other things being equal, which one of the following is most likely to cause a decrease in the wage differential?

  • A fall in the demand for unskilled workers

  • A fall in the size of the labour force

  • An increase in the demand for skilled workers

  • An increase in the proportion of the labour force with a degree

4
Sme Calculator
1 mark

In a labour market dominated by a monopsonist, wages and employment are usually lower than in a competitive labour market. This is because a monopsonist.

  • employs workers up to the point where the marginal revenue product of labour is equal to the wage rate.

  • is a monopoly supplier of labour.

  • equates the marginal revenue product of labour with its marginal cost not the wage rate.

  • restricts output to raise the price of the product sold.

5
Sme Calculator
1 mark

The diagram below shows the market for bricklayers.

q4-june-2017-aqa-a-level-economics


The original equilibrium wage is W1 and the number of bricklayers employed is N1. Which one of the following events is most likely to increase the wage paid to bricklayers to W2 and increase employment to N2?

  • A cut in bank rate leading to a fall in mortgage interest rates

  • A fall in the number of young people training as apprentice bricklayers

  • An improvement in working conditions in the construction industry

  • An increase in the wages paid to electricians in the construction industry

6
Sme Calculator
1 mark

The diagram below represents the market for unskilled agricultural labourers where the demand for agricultural labourers is DL and the supply is SL. The trade union representing agricultural labourers has negotiated a minimum wage of OWmin for its members.

q19-june-2017-aqa-a-level-economics


The effect of implementing a minimum wage of OWmin is that

  • cyclical unemployment increases by (ON3 – ON1).

  • frictional unemployment increases by (ON2 – ON1).

  • real wage unemployment increases by (ON3 – ON1).

  • the natural rate of unemployment increases by (ON2 – ON1).

71 mark

The average university graduate can expect to earn more over their working life than the average school leaver.

This is most likely to be explained by

  • discrimination in the labour markets for non-graduates.

  • the higher marginal revenue productivity of graduates.

  • the higher price elasticity of demand for graduates.

  • the relatively low elasticity of supply of non-graduates.

81 mark

An increase in the national minimum wage may be used to make the distribution of income more equal. Such a policy is most likely to be effective when the elasticity of demand for labour in low-paid work is

  • elastic.

  • inelastic.

  • perfectly elastic

  • unitary elastic.

91 mark

Figure 9 shows two labour supply (S1 and S2) curves for workers qualified to the level necessary to be employed in a particular industry.

Line graph titled 'Figure 9', showing two upward-sloping supply lines, S1 and S2, relating wage rate to the number of workers.

All other things being equal, the shift of the supply of labour curve from S1 to S2 is most likely to be explained by a reduction in

  • job security for qualified workers in the industry.

  • the average wage rate in the industry

  • the productivity of workers in the industry.

  • the qualifications required by the industry

101 mark

Figure 6 shows the supply of labour (SL) and demand for labour (DL) in a perfectly competitive labour market.

Graph titled "Figure 6" showing labour supply and demand curves intersecting, with wage rate on the vertical axis, number of workers employed on the horizontal.

All other things being equal, which one of the following combinations would mean that wages in this labour market are likely to increase from W1?

  • A fall in the demand for the final product and a rise in the number of workers training to enter this labour market

  • A fall in wages in a labour market with similar skill requirements and a fall in the price of a substitute for the output produced

  • An increase in the minimum qualifications required for workers in the industry and a fall in the price of a complement for the output produced

  • An increase in the unemployment rate across the economy and firms substituting capital for labour in the production process

111 mark

Which one of the following is most likely to affect the elasticity of demand for labour in a particular occupation?

  • The proportion of employers’ total costs which are made up by wages

  • The quantity demanded of the final output that the workers produce

  • The size of the pool of skilled labour available in the local area

  • The time taken to achieve the qualifications needed for the role

121 mark

Figure 8 shows the marginal cost (MCL), average cost (ACL) and marginal revenue product (MRPL) curves for labour in a specialised computer programming industry.

Graph of wage rate vs number of workers, showing intersecting MCL, ACL, and MRPL curves with labelled wage levels W1, W2, W3 and quantities Q1, Q2.

Following a series of mergers between firms in this industry, a single large firm remains as a monopsony employer.

Which one of the following is the most likely to result from a competitive labour market being replaced by a monopsony employer?

  • The total amount paid in wages will fall from (W2 × Q2 ) to (W3 × Q1 ).

  • The total amount paid in wages will increase from (W3 × Q1) to (W1 × Q1)

  • The wage rate will fall from W1 to W2.

  • The wage rate will increase from W3 to W2

131 mark

All other things being equal, Table 7 shows how the number of workers employed by a profit-maximising firm affects its total output per hour and the price it is able to charge for the product produced

Table 7

Number of workers

Total output per hour

Price (£)

1

3

5.00

2

7

4.50

3

15

4.20

4

20

4.10

5

24

4.00

The firm pays its workers £18 per hour. It does not have any other variable costs and its fixed costs are £3 per hour.

How many workers will the firm employ?

  • 2

  • 3

  • 4

  • 5

141 mark

Figure 6 shows a perfectly competitive labour market. The left-hand diagram shows the supply of labour (SLI) and demand for labour (DLI) for the industry. The right-hand diagram shows the demand for labour (DLF) for one firm in the industry

Two graphs: left shows industry labour supply and demand intersecting at wage W1; right shows a firm's labour demand curve with constant wage W1.

All other things being equal, which one of the following is most likely to cause an increase in the wage rate paid by the firm?

  • A decrease in the price of a substitute for the industry's product

  • A price increase for a good jointly demanded with the industry's product

  • An increase in the number of workers qualified to work in the industry

  • An increase in the price of the industry's product caused by changing tastes

151 mark

Figure 8 shows the market demand (DL) and supply (SL) of labour in a labour market with a trade union. The initial trade union negotiated wage is W2

The trade union negotiates an increase in the wage from W2 to W3. All other things being equal, unemployment in this labour market will increase by

  • 3 000

  • 5 000

  • 8 000

  • 16 000