Economic Performance (AQA A Level Economics): Exam Questions

Exam code: 7136

3 hours22 questions
1
Sme Calculator
1 mark

Table 1 contains data for the rates of growth of nominal and real GDP and the rate of inflation for an economy in a given year. Which one of the following combinations,

A, B, C or D, shows the correct relationship between the three variables? 


Nominal GDP growth

Real GDP growth

Inflation

A

–2%

0%

+2%

B

+4%

+3%

–1%

C

+5%

+5%

+1%

D

–5%

–2%

–3%

    21 mark

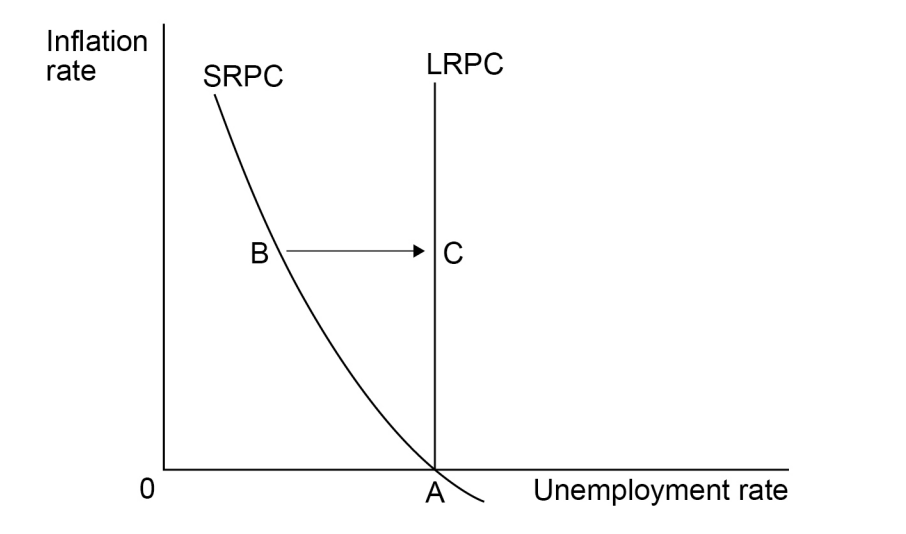
    The long-run Phillips curve shows that

    • the expected rate of inflation is zero.

    • there is an inverse relationship between unemployment and inflation in the long run.

    • there is no trade-off between reducing inflation and lower unemployment in the long run.

    • unemployment can only be reduced in the long run by an increase in aggregate demand.

    3
    Sme Calculator
    1 mark

    An economy is estimated to be experiencing a 2% rate of frictional unemployment plus a 3% rate of structural and real wage unemployment. If it is also experiencing cyclical unemployment of 4%, its natural rate of unemployment is most likely to be

    • 3%

    • 5%

    • 6%

    • 9%

    4
    Sme Calculator
    1 mark

    The table below contains selected data on a country’s macroeconomic performance over a 20 year period. 


    Year


    Unemployment (%)


    Rate of inflation (%)

    Balance of trade on current account

    ($ bn)

    1998

    6.0

    3.5

    –20

    2003

    5.8

    3.0

    –19

    2008

    5.5

    2.5

    –12

    2013

    5.2

    2.0

    –2

    2018

    5.0

    1.5

    +3


    All other things being equal, which one of the following, A, B, C or D, can be inferred from the above data?

    • The natural rate of unemployment is falling

    • The price level is increasing more slowly

    • The volume of exports is increasing

    • There is an inverse relationship between unemployment and inflation

    5
    Sme Calculator
    1 mark

    All other things being equal, if the velocity of circulation is constant, the quantity theory of money based on Fisher’s equation of exchange, MV=PQ, predicts that an x% increase in the money supply will always cause an x%

    • decrease in the rate of interest.

    • increase in nominal national income.

    • increase in real national income.

    • increase in the rate of economic growth

    61 mark

    The diagram below shows the actual level of real GDP and the trend level of real GDP over time for an economy. The economy starts its recovery from recession at point M. After several years of growth the economy reaches point N.

    q13-paper-3-june-2019-aqa-a-level-economics

    All other things being equal, which one of the following is the most likely consequence of the economy’s growth path between points M and N? 

    • A decrease in the level of interest rates due to deflation.

    • A decrease in the rate of inflation due to increased output.

    • An increase in investment due to the accelerator process.

    • An increase in the value of the multiplier due to a rise in the savings ratio.

    71 mark

    The short-run Phillips curve below illustrates the relationship between unemployment and inflation in an economy.

    The Phillips curve shows that in this economy.

    • high inflation leads to high unemployment.

    • there is an inversely proportional relationship between unemployment and inflation.

    • the trade-off for reducing inflation from 7% to 3% is a 4% increase in unemployment.

    • the trade-off for reducing unemployment from 7% to 4% is 3% inflation.

    81 mark

    The table below shows indices for real GDP and consumer prices in an economy over six quarters.

    Quarter

    Index of real GDP

    Index of consumer

    prices

    1

    106

    100

    2

    105

    105

    3

    104

    111

    4

    105

    116

    5

    107

    120

    6

    110

    123

    During these six quarters the economy experienced 

    • deflation and a recession

    • disinflation when in recession

    • disinflation when recovering from recession.

    • rising inflation when recovering from

    91 mark

    The primary measure of unemployment in the UK is based on the

    • number of people joining the labour force minus the number of people leaving the labour force.

    • number of people not working who are of working age.

    • the number of people actively seeking work and available to start work.

    • proportion of the population of working age without a job.

    10
    Sme Calculator
    1 mark

    The table below shows the Consumer Prices Index for a country over a number of years.

     Year

    End of year prices index

    1

    100

    2

    98

    3

    103

    4

    105

    5

    106

    6

    104

    7

    107

     Which one of the following can be concluded from the table?

    • The country suffered disinflation in Year 5

    • The inflation rate was highest in Year 7

    • The only time the country suffered deflation was in Year 2

    • Real incomes fell between Year 1 and Year 7