Displacement-Time Graphs (Edexcel A Level Maths): Revision Note
Exam code: 9MA0

Written by: Dan Finlay
Updated on
Did this video help you?
Displacement-time graphs
What is a displacement-time graph?
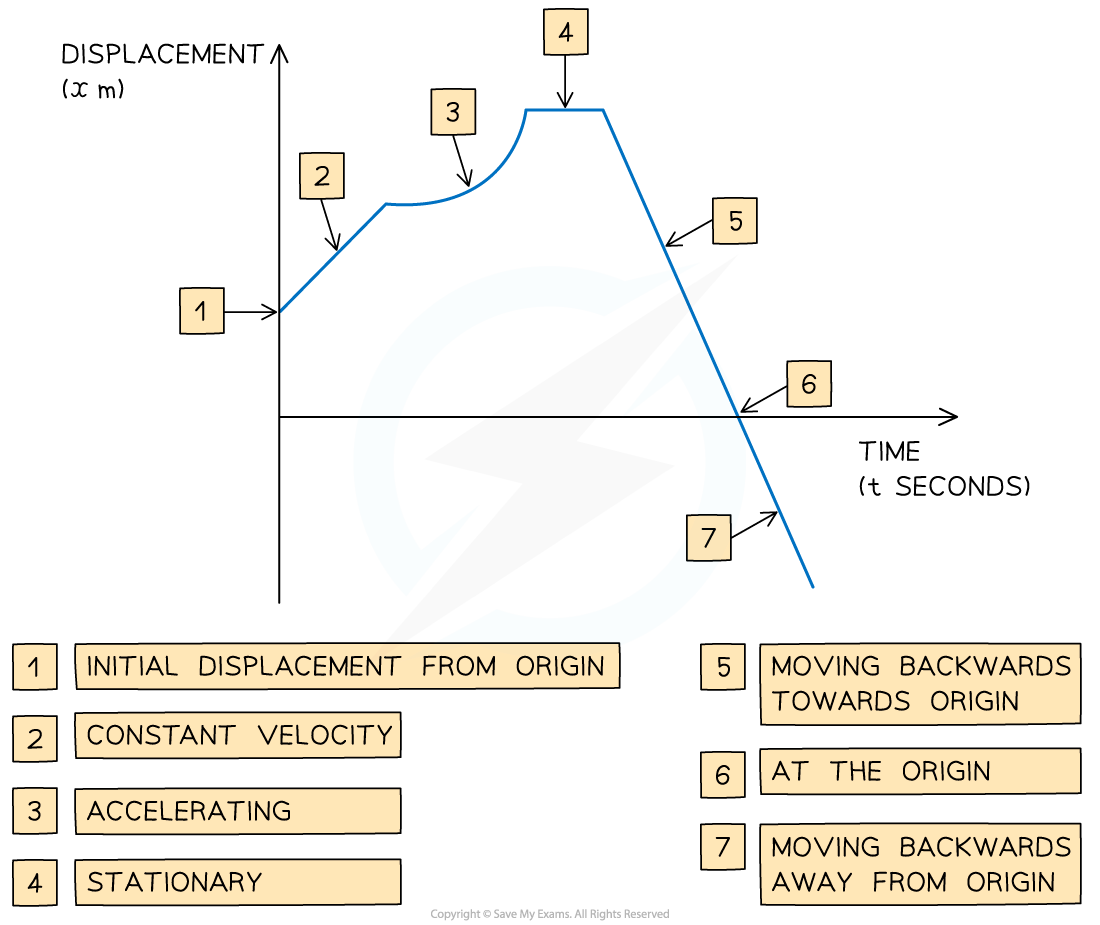
Displacement-time graphs show the displacement of an object from a fixed origin as it moves in a straight line
They show displacement (on the vertical axis) against time (on the horizontal axis)
Displacement-time graphs can go below the horizontal axis whereas distance-time graphs can not
Distance can not be negative whereas displacement can be
What are the key features of a displacement-time graph?
The gradient of the graph equals the velocity of the object
A positive gradient means the object is travelling forwards
A negative gradient means that the object is travelling backwards
The steeper the line, the greater the speed
A straight line shows that the object is moving at a constant velocity
A curved line shows that the object is accelerating or decelerating
A horizontal line shows that the object is stationary
If the graph touches the x-axis, then the object is at the origin at that time
How do I find the average speed and the average velocity of a journey?
![]()
The average speed can not be negative as speed is a scalar quantity and can only take a positive value
format('truetype')%3Bfont-weight%3Anormal%3Bfont-style%3Anormal%3B%7D%3C%2Fstyle%3E%3C%2Fdefs%3E%3Ctext%20font-family%3D%22stix278c526c79a467f767590df7316%22%20font-size%3D%2218%22%20text-anchor%3D%22middle%22%20x%3D%2230.5%22%20y%3D%2231%22%3EAverage%3C%2Ftext%3E%3Ctext%20font-family%3D%22stix278c526c79a467f767590df7316%22%20font-size%3D%2218%22%20text-anchor%3D%22middle%22%20x%3D%2295.5%22%20y%3D%2231%22%3Evelocity%3C%2Ftext%3E%3Ctext%20font-family%3D%22stix278c526c79a467f767590df7316%22%20font-size%3D%2218%22%20text-anchor%3D%22middle%22%20x%3D%22137.5%22%20y%3D%2231%22%3E%3D%3C%2Ftext%3E%3Cline%20stroke%3D%22%23000%22%20stroke-linecap%3D%22square%22%20stroke-width%3D%221%22%20x1%3D%22152.5%22%20x2%3D%22397.5%22%20y1%3D%2226.5%22%20y2%3D%2226.5%22%2F%3E%3Ctext%20font-family%3D%22stix278c526c79a467f767590df7316%22%20font-size%3D%2218%22%20text-anchor%3D%22middle%22%20x%3D%22204.5%22%20y%3D%2218%22%3EDisplacement%3C%2Ftext%3E%3Ctext%20font-family%3D%22stix278c526c79a467f767590df7316%22%20font-size%3D%2218%22%20text-anchor%3D%22middle%22%20x%3D%22276.5%22%20y%3D%2218%22%3Efrom%3C%2Ftext%3E%3Ctext%20font-family%3D%22stix278c526c79a467f767590df7316%22%20font-size%3D%2218%22%20text-anchor%3D%22middle%22%20x%3D%22326.5%22%20y%3D%2218%22%3Estarting%3C%2Ftext%3E%3Ctext%20font-family%3D%22stix278c526c79a467f767590df7316%22%20font-size%3D%2218%22%20text-anchor%3D%22middle%22%20x%3D%22376.5%22%20y%3D%2218%22%3Epoint%3C%2Ftext%3E%3Ctext%20font-family%3D%22stix278c526c79a467f767590df7316%22%20font-size%3D%2218%22%20text-anchor%3D%22middle%22%20x%3D%22253.5%22%20y%3D%2246%22%3ETime%3C%2Ftext%3E%3Ctext%20font-family%3D%22stix278c526c79a467f767590df7316%22%20font-size%3D%2218%22%20text-anchor%3D%22middle%22%20x%3D%22296.5%22%20y%3D%2246%22%3Etaken%3C%2Ftext%3E%3C%2Fsvg%3E)
The average velocity is a vector quantity and can be positive, zero or negative
Worked Example
An athlete is training by jogging in a straight line.
The displacement-time graph below shows the displacement of the athlete from her starting point throughout her motion.
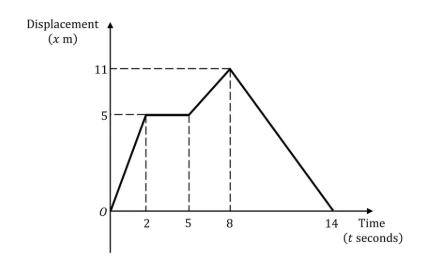
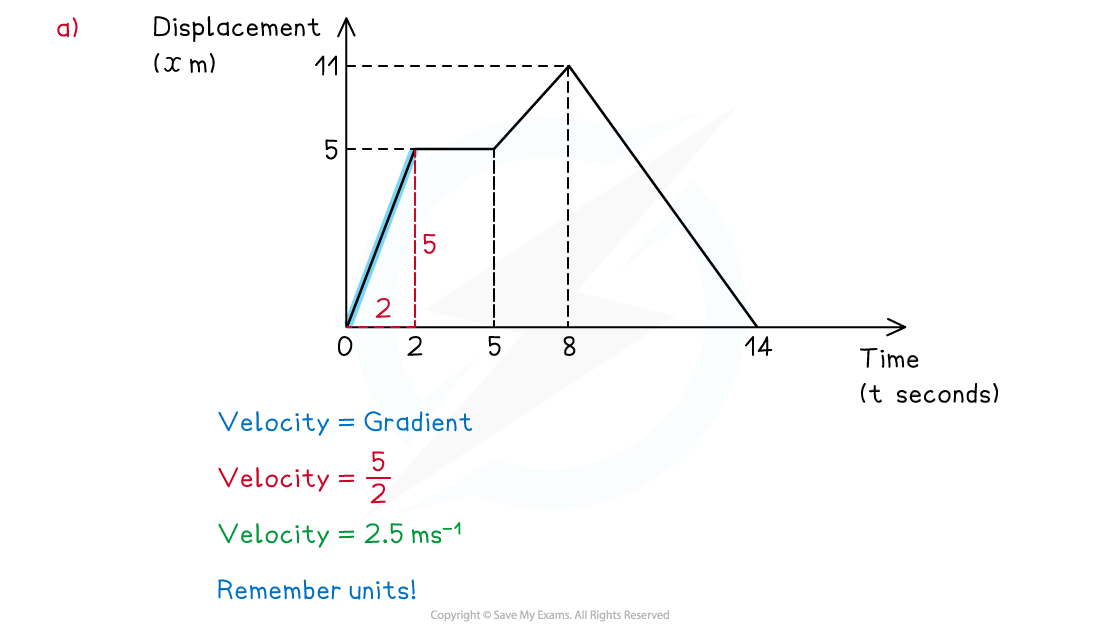
(a) Calculate the velocity of the athlete during the first 2 seconds.
Answer:
(b) Describe the motion of the athlete between the times of 2 seconds and 5 seconds.
Answer:

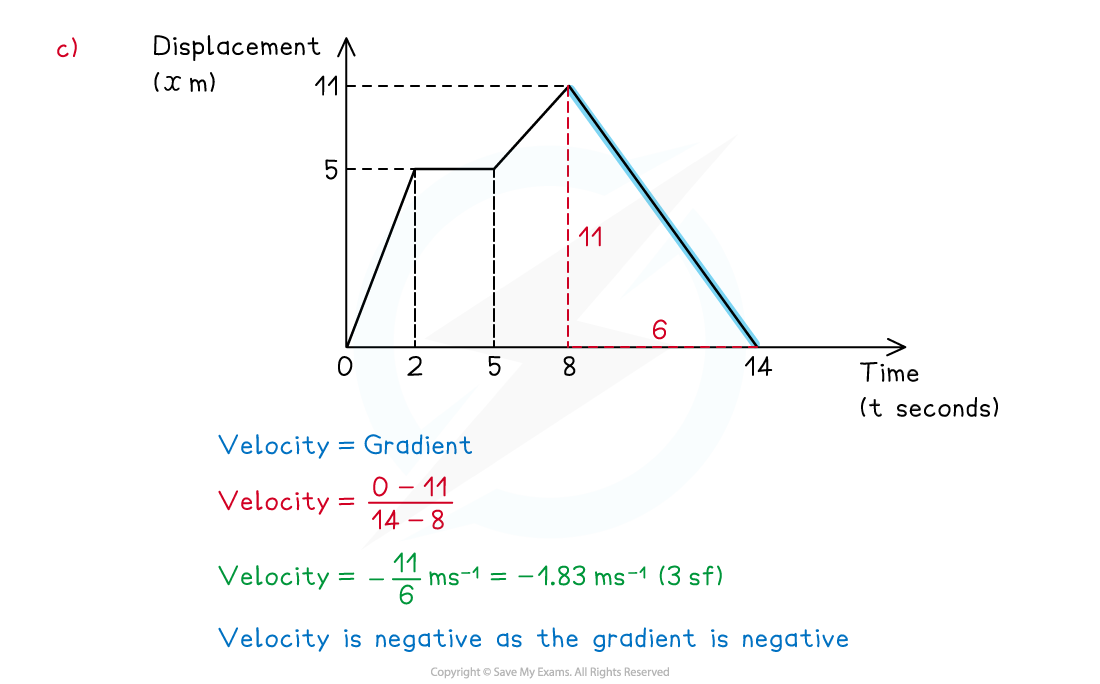
(c) Calculate the velocity of the athlete at 10 seconds.
Answer:
(d) Find the total distance travelled by the athlete during the 14 seconds.
Answer:

Examiner Tips and Tricks
Be careful to spot if you are working with a displacement-time graph or a velocity-time graph.
Be careful to spot if you are working with a displacement-time graph or a distance-time graph
Check where the graph starts from on the y-axis, the object does not have to start at 0. For example, if the graph starts at 100, the scenario could be a student on a walk starting 100 m from their house.
Distance is a scalar so it can not be negative whereas displacement from a starting point can be.
Think about the units when calculating, make sure they are consistent.

Unlock more, it's free!
Join the 100,000+ Students that ❤️ Save My Exams
the (exam) results speak for themselves:

Was this revision note helpful?