Human Population Dynamics & Structure (Cambridge (CIE) AS Environmental Management): Exam Questions

Exam code: 8291

27 mins4 questions
1a8 marks

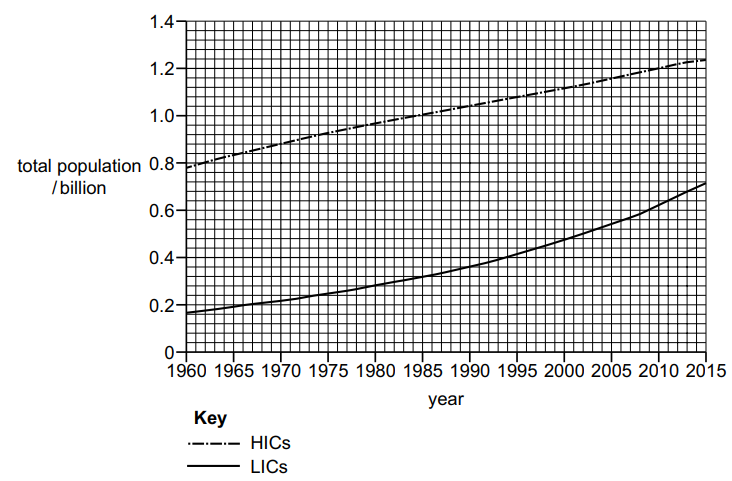
Italy is a high-income economy country (HIC) in Europe and Bangladesh is a low-income economy country (LIC) in Asia. Table 1.1 shows population data for Italy and Bangladesh in 1990 and 2010.

Table 1.1

country

area / km2

population 1990

population density 1990 /  people km–2

population 2010

population density 2010 /  people km–2

percentage increase in population density

Bangladesh

147 630

105 983 136

151 616 777

1027.0

43.1

Italy

301 340

 57 007 577

189.2

59 588 066

 197.7

(i) Calculate the population density of Bangladesh in 1990.

Give the answer to 1 decimal place.

population density 1990 ..................................... people km–2

[2]

(ii) Calculate the percentage increase in population density for Italy.

Give the answer to 3 significant figures.

percentage increase .......................................................%

[2]

(iii) Suggest how social factors can cause the changes in population density in Bangladesh and Italy. Refer to the data in your answer.

[4]

1b5 marks

Fig. 1.1 shows two population pyramids representing the percentage of the population in different age groups in Italy in 1950 and 2010.
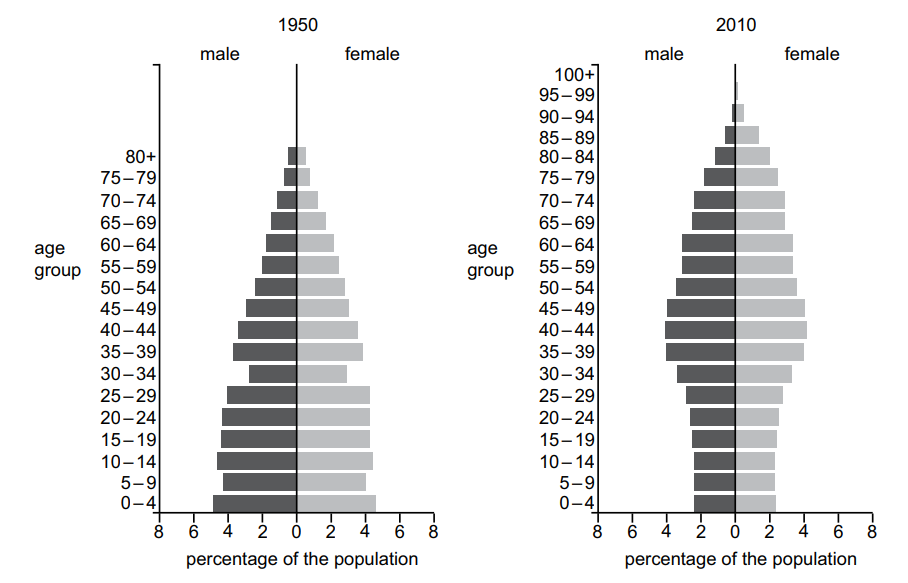
Population pyramids comparing age and gender distribution in 1950 and 2010; wider base and older age bars in 2010 indicate demographic changes.

Fig. 1.1

(i) Describe the changes in population distribution using data from Fig. 1.1.

[2]

(ii) Describe the impacts that the changes in (i) could cause.

[3]

24 marks

The graph in Fig. 5.1 shows data for total population of high-income economy countries (HICs) and low-income economy countries (LICs) between 1960 and 2015.

Line graph showing total population growth from 1960 to 2015 in billions for high-income countries (dashed line) and low-income countries (solid line).

Fig. 5.1

(i) The data in Fig. 5.1 show a percentage increase in population of 59% for HICs from 1960 to 2015.

Calculate the percentage increase in population for LICs from 1960 to 2015.

Give your answer to 2 significant figures.

........................................................% [2]

(ii) Use the data to compare the trend in population for LICs and for HICs between 1960 and 2015.

[2]

3a4 marks

Fig. 3.1 shows data about birth and death rates and the population of a country.

Graph showing birth and death rates over time. Line A indicates death rate, Line B shows birth rate; shaded area represents changes in population growth.

Fig. 3.1

(i) Line A and line B represent the birth and death rates of the country.

Identify the line that represents the death rate. Use Fig. 3.1 to give reasons for your answer.

[2]

(ii) Birth and death rates cause population change.

Explain one other cause of population change.

[2]

3b3 marks

Table 3.1 shows the dependency ratio for the country in 1990 and 2020.

Table 3.1

dependency ratio in 1990

dependency ratio in 2020

93

55

Describe three changes that could cause the change in dependency ratios shown in Table 3.1.

43 marks

Light pollution is caused by the use of artificial light. Light pollution has been linked to a rapid decrease in insect populations.

(i) Suggest why the use of artificial light is increasing.

[1]

(ii) Suggest why a decrease in insect populations is of global concern.

[2]