1a
5 marks
Fig. 4.1 is a food web that shows some feeding relationships in a rainforest.
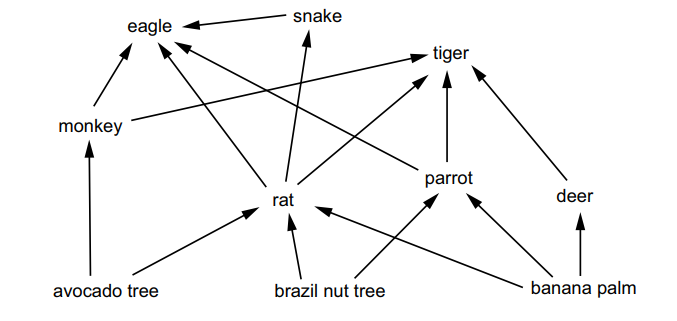
Fig. 4.1
(i) Label the pyramid of biomass using an organism from each trophic level in a food chain within this food web.
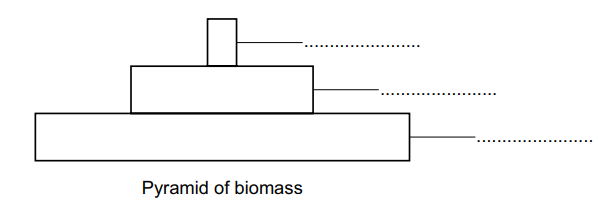
[2]
(ii) Explain the shape of the pyramid of biomass shown in (a)(i).
[3]
1b
2 marks
Table 4.1 shows data on productivity.
Table 4.1
type of land | average annual net primary productivity / g m–2 |
tropical rainforest | 2200 |
agricultural | 650 |
(i) Tropical rainforest is an example of an ecosystem.
Define ecosystem productivity
[1]
(ii)
Suggest one reason why the productivity of the agricultural land is much smaller than the tropical rainforest.
[1]
Was this exam question helpful?