1
2 marks
The graph in Fig. 2.1 shows the increase in sea level due to ice loss from the Antarctic ice sheet between 1993 and 2017.
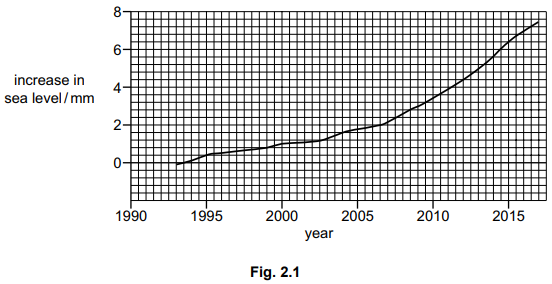
Suggest an explanation for the trend shown by the data.
Was this exam question helpful?
Exam code: 8291
The graph in Fig. 2.1 shows the increase in sea level due to ice loss from the Antarctic ice sheet between 1993 and 2017.
Suggest an explanation for the trend shown by the data.
Was this exam question helpful?
Fig. 4.1 contains information about the Mekong river basin, which extends over a large area of land in southeast Asia.

Fig 4.1
Describe the possible impacts of climate change on the environment and on the people living in the Mekong river basin area.
Use information from the diagram in your answer.
Was this exam question helpful?
Corals are very sensitive to environmental conditions.
Explain how climate change can decrease the population of staghorn corals.
Was this exam question helpful?