1
9 marks
Evaluate the impact of migration on the character of a place that you have studied and people’s lived experience of that place.
Was this exam question helpful?
Exam code: 7036
Evaluate the impact of migration on the character of a place that you have studied and people’s lived experience of that place.
Was this exam question helpful?
Summarise the causes of social segregation in urban areas.
Was this exam question helpful?
With reference to contrasting urban areas, evaluate the relative success of strategies used to address issues associated with economic inequality.
Was this exam question helpful?
Figure 9 shows the Index of Multiple Deprivation for the city of Preston, Lancashire in 2015.
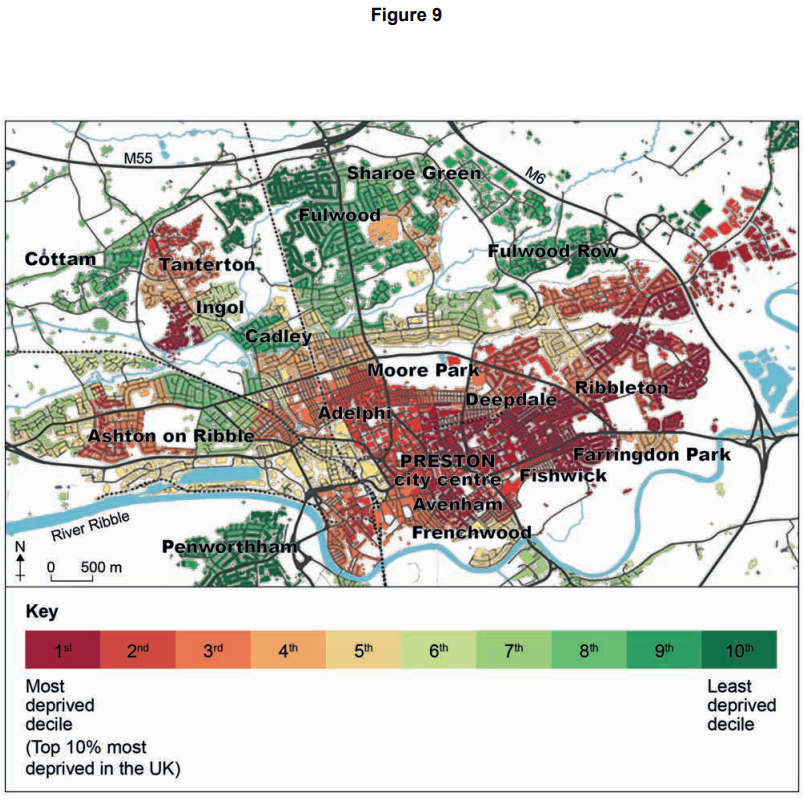
Figure 10 shows the percentage of Preston residents who cannot speak English box (2011 census).
Was this exam question helpful?
Figure 9 shows the Index of Multiple Deprivation for the city of Preston, Lancashire in 2015.
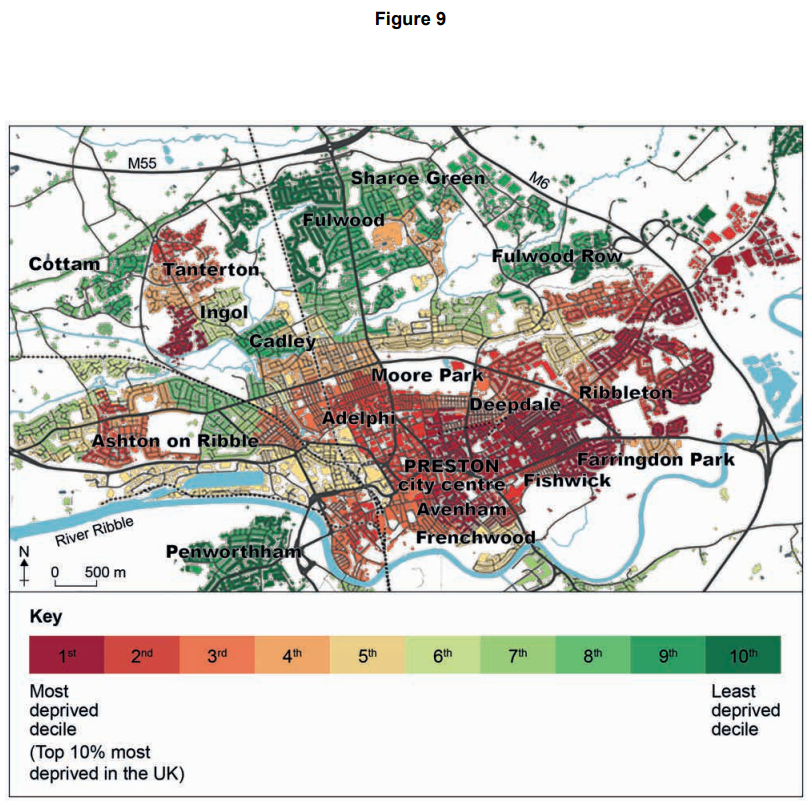
Figure 10 shows the percentage of Preston residents who cannot speak English box (2011 census).
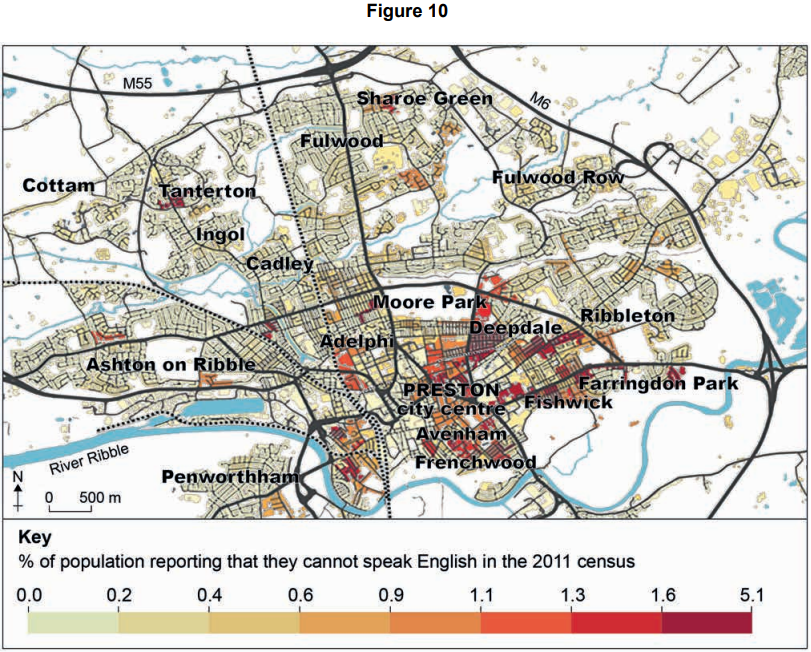
Analyse the data shown in Figure 9 and Figure 10.
Was this exam question helpful?