1
6 marks
Figure 5 is a geomorphological map of an Icelandic glacier, Virkisjökull–Falljökull.
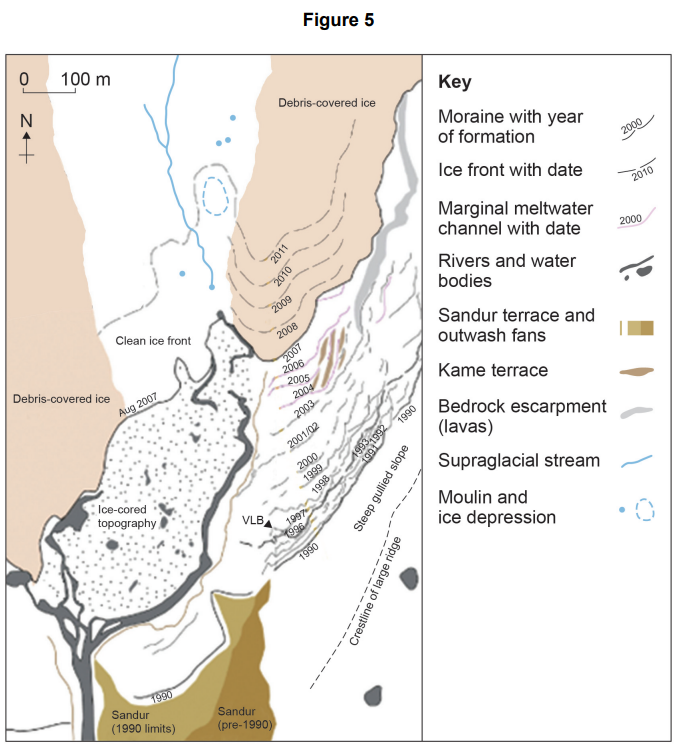
With reference to Figure 5, interpret the evidence that this glacier is changing.
Was this exam question helpful?
Exam code: 7036
Figure 5 is a geomorphological map of an Icelandic glacier, Virkisjökull–Falljökull.
With reference to Figure 5, interpret the evidence that this glacier is changing.
Was this exam question helpful?
Figure 3a shows information about the area of land covered by glaciers in different regions of the world in 2020.
Figure 3b shows information about the average annual loss of ice from glaciers in the same regions of the world, from 2000 to 2019.
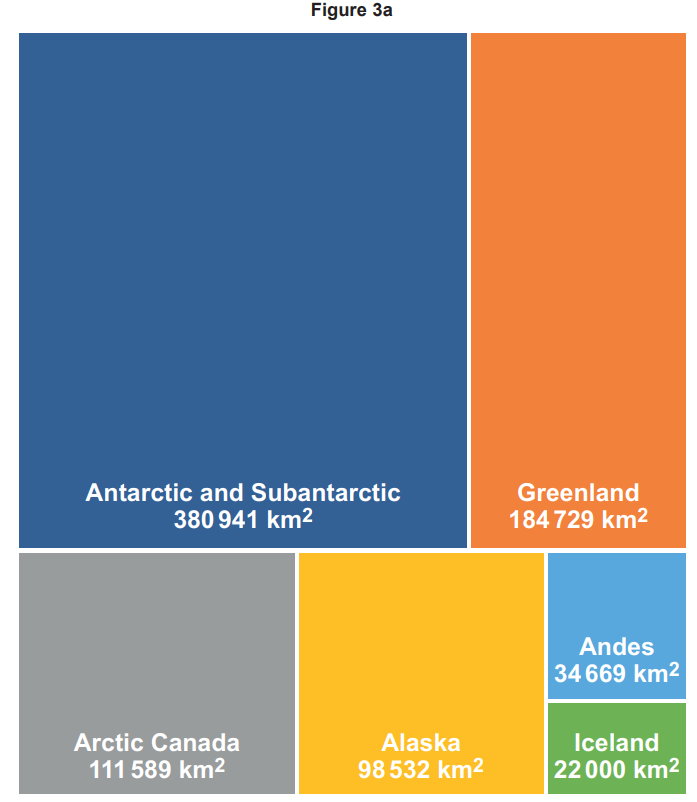
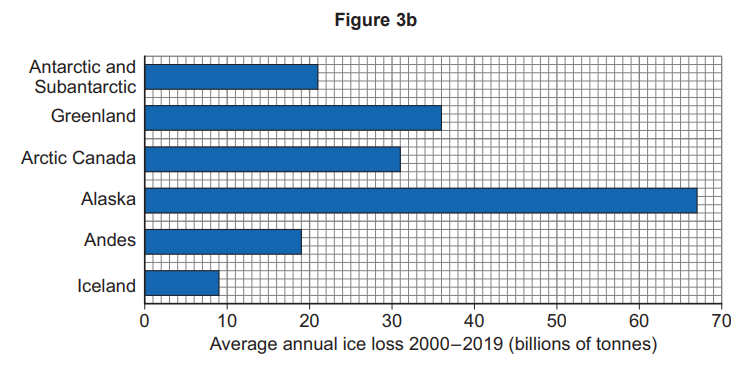
Analyse the information shown in Figure 3a and Figure 3b.
Was this exam question helpful?