Storm Hazards (AQA AS Geography): Exam Questions

Exam code: 7036

46 mins6 questions
1
1 mark

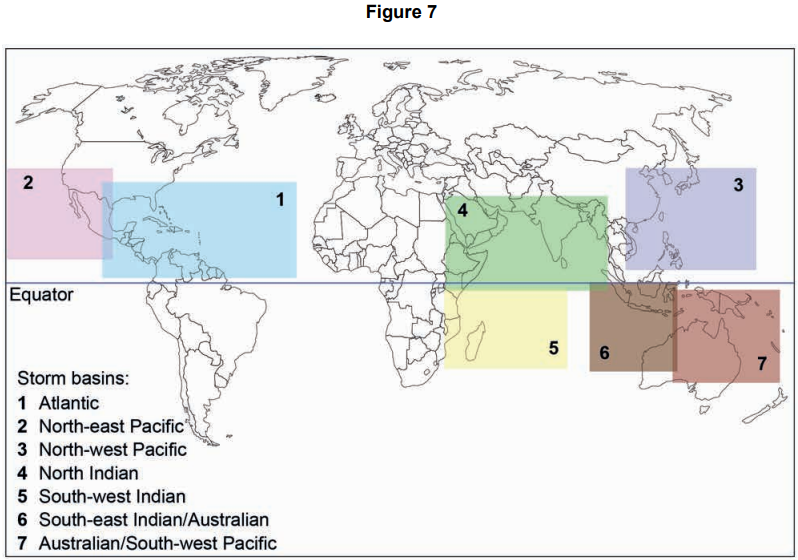
In what conditions do tropical storms tend to develop?

  • Cooler waters around 15 °C; high pressure conditions with rising air; approximately 20° either side of the equator; usually forming at the end of winter; diverging air masses have smaller impacts.

  • Warm water around 25 °C; low pressure conditions with descending air; occurring along the equator; usually forming in spring; converging air masses.

  • Warmer water around 20 °C; high pressure conditions with rising air; forming close to the equator; usually forming in summer; converging air masses.

  • Warmer waters over 25 °C; low pressure conditions with rising air; forming 5°−10° either side of the equator; usually forming late summer; converging air masses.

2
9 marks

Evaluate the impact that a tropical storm has had on the character of a place that you have studied and how the storm has affected people’s lived experience of this place after the storm.

3
20 marks

‘The predictability of storm hazards allows people to prepare for them and mitigate their impacts.’

How far do you agree with this statement?

4
1 mark

Which of the following describes primary impacts of tropical storms?

  • Children’s education and well-being suffer as infrastructure such as schools need to be re-built.

  • Death and injury due to flying debris, fallen power lines and storm surges.

  • Future food security is reduced as farmers have to re-plant crops and food prices increase due to scarcity.

  • Insurance costs increase and residents are unable to return home for many months.

5
9 marks

With reference to a recent tropical storm that you have studied, assess the extent to which the storm affected the character of a place.

6
6 marks

Figure 7 shows tropical storm basins where storms occur on a regular basis.

World map showing storm basins: Atlantic, North-east Pacific, North-west Pacific, North Indian, South-west Indian, South-east Indian/Australian, Australian/South-west Pacific.

Figure 8 shows data about the frequency of storm events in each tropical storm basin between 1981 and 2010.

Table titled 'Figure 8' shows tropical storm data by basin: Atlantic, North-east Pacific, North-west Pacific, and others, with max, min, and average counts.

Analyse the data shown in Figure 7 and Figure 8.