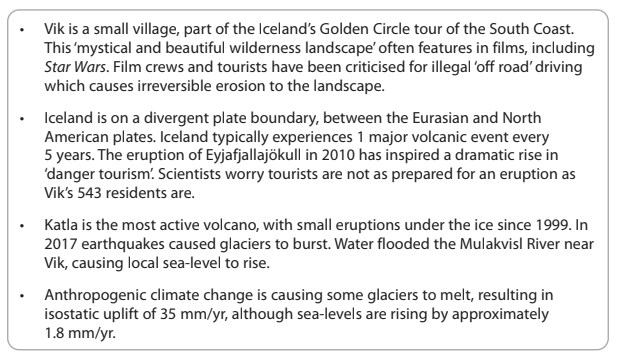
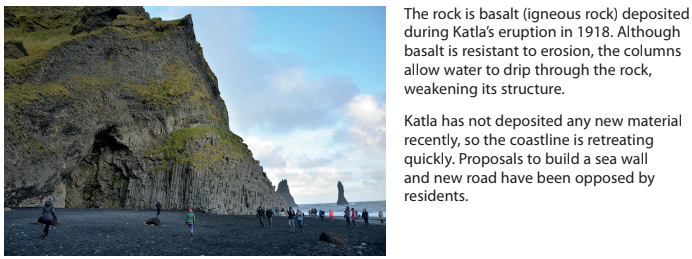
1
2 marks
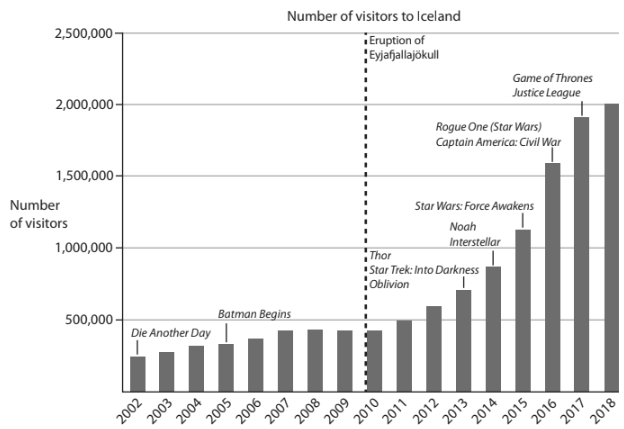
Study Figure 5a below, which shows the measurements taken of the volume of cliff material eroded over a six month period.
Average volume of cliff material eroded (metres3) | |
|---|---|
August | 1 |
September | 3 |
October | 35 |
November | 592 |
December | 994 |
January | 186 |
Figure 5a
Measurements of the volume of eroded cliff material
Calculate the mean volume of cliff material eroded per month.
Show your working.
Give your answer to 2 decimal places.
............................... metres3
Was this exam question helpful?
format('truetype')%3Bfont-weight%3Anormal%3Bfont-style%3Anormal%3B%7D%40font-face%7Bfont-family%3A'math192fcdfbcdc53f7ff438a9b94ac'%3Bsrc%3Aurl(data%3Afont%2Ftruetype%3Bcharset%3Dutf-8%3Bbase64%2CAAEAAAAMAIAAAwBAT1MvMi7iBBMAAADMAAAATmNtYXDEvmKUAAABHAAAAExjdnQgDVUNBwAAAWgAAAA6Z2x5ZoPi2VsAAAGkAAABu2hlYWQQC2qxAAADYAAAADZoaGVhCGsXSAAAA5gAAAAkaG10eE2rRkcAAAO8AAAAFGxvY2EAHTwYAAAD0AAAABhtYXhwBT0FPgAAA%2BgAAAAgbmFtZaBxlY4AAAQIAAABn3Bvc3QB9wD6AAAFqAAAACBwcmVwa1uragAABcgAAAAUAAADSwGQAAUAAAQABAAAAAAABAAEAAAAAAAAAQEAAAAAAAAAAAAAAAAAAAAAAAAAAAAAAAAAAAAAACAgICAAAAAg1UADev96AAAD6ACWAAAAAAACAAEAAQAAABQAAwABAAAAFAAEADgAAAAKAAgAAgACACsALgA9IhL%2F%2FwAAACsALgA9IhL%2F%2F%2F%2FW%2F9T%2Fxt3yAAEAAAAAAAAAAAAAAAABVAMsAIABAABWACoCWAIeAQ4BLAIsAFoBgAKAAKAA1ACAAAAAAAAAACsAVQCAAKsA1QEAASsABwAAAAIAVQAAAwADqwADAAcAADMRIRElIREhVQKr%2FasCAP4AA6v8VVUDAAABAIAAVQLVAqsACwBJARiyDAEBFBMQsQAD9rEBBPWwCjyxAwX1sAg8sQUE9bAGPLENA%2BYAsQAAExCxAQbksQEBExCwBTyxAwTlsQsF9bAHPLEJBOUxMBMhETMRIRUhESMRIYABAFUBAP8AVf8AAasBAP8AVv8AAQAAAQAgAAAAoACAAAMALxgBsAQQsAPUsAMQsALUsAMQsAA8sAIQsAE8ALAEELAD1LADELACPLAAELABPDAxNzMVIyCAgICAAAIAgADrAtUCFQADAAcAZRgBsAgQsAbUsAYQsAXUsAgQsAHUsAEQsADUsAYQsAc8sAUQsAQ8sAEQsAI8sAAQsAM8ALAIELAG1LAGELAH1LAHELAB1LABELAC1LAGELAFPLAHELAEPLABELAAPLACELADPDEwEyE1IR0BITWAAlX9qwJVAcBV1VVVAAEAgAFVAtUBqwADADAYAbAEELEAA%2FawAzyxAgf1sAE8sQUD5gCxAAATELEABuWxAAETELABPLEDBfWwAjwTIRUhgAJV%2FasBq1YAAAEAAAABAADVeM5BXw889QADBAD%2F%2F%2F%2F%2F1joTc%2F%2F%2F%2F%2F%2FWOhNzAAD%2FIASAA6sAAAAKAAIAAQAAAAAAAQAAA%2Bj%2FagAAF3AAAP%2B2BIAAAQAAAAAAAAAAAAAAAAAAAAUDUgBVA1YAgADIACADVgCAA1YAgAAAAAAAAAAoAAAAoQAAAOcAAAFxAAABuwABAAAABQBeAAUAAAAAAAIAgAQAAAAAAAQAAN4AAAAAAAAAFQECAAAAAAAAAAEAEgAAAAAAAAAAAAIADgASAAAAAAAAAAMAMAAgAAAAAAAAAAQAEgBQAAAAAAAAAAUAFgBiAAAAAAAAAAYACQB4AAAAAAAAAAgAHACBAAEAAAAAAAEAEgAAAAEAAAAAAAIADgASAAEAAAAAAAMAMAAgAAEAAAAAAAQAEgBQAAEAAAAAAAUAFgBiAAEAAAAAAAYACQB4AAEAAAAAAAgAHACBAAMAAQQJAAEAEgAAAAMAAQQJAAIADgASAAMAAQQJAAMAMAAgAAMAAQQJAAQAEgBQAAMAAQQJAAUAFgBiAAMAAQQJAAYACQB4AAMAAQQJAAgAHACBAE0AYQB0AGgAIABGAG8AbgB0AFIAZQBnAHUAbABhAHIATQBhAHQAaABzACAARgBvAHIAIABNAG8AcgBlACAATQBhAHQAaAAgAEYAbwBuAHQATQBhAHQAaAAgAEYAbwBuAHQAVgBlAHIAcwBpAG8AbgAgADEALgAwTWF0aF9Gb250AE0AYQB0AGgAcwAgAEYAbwByACAATQBvAHIAZQAAAwAAAAAAAAH0APoAAAAAAAAAAAAAAAAAAAAAAAAAALkHEQAAjYUYALIAAAAVFBOxAAE%2F)format('truetype')%3Bfont-weight%3Anormal%3Bfont-style%3Anormal%3B%7D%3C%2Fstyle%3E%3C%2Fdefs%3E%3Ctext%20font-family%3D%22Times%20New%20Roman%22%20font-size%3D%2218%22%20font-style%3D%22italic%22%20text-anchor%3D%22middle%22%20x%3D%222.5%22%20y%3D%2242%22%3Et%3C%2Ftext%3E%3Ctext%20font-family%3D%22math192fcdfbcdc53f7ff438a9b94ac%22%20font-size%3D%2216%22%20text-anchor%3D%22middle%22%20x%3D%2214.5%22%20y%3D%2242%22%3E%3D%3C%2Ftext%3E%3Cline%20stroke%3D%22%23000000%22%20stroke-linecap%3D%22square%22%20stroke-width%3D%221%22%20x1%3D%2225.5%22%20x2%3D%22121.5%22%20y1%3D%2235.5%22%20y2%3D%2235.5%22%2F%3E%3Ctext%20font-family%3D%22horizontalbf65417dcecc7f2b0006e%22%20font-size%3D%2213%22%20text-anchor%3D%22middle%22%20x%3D%2246.5%22%20y%3D%228%22%3E%26%23x23AF%3B%3C%2Ftext%3E%3Ctext%20font-family%3D%22horizontalbf65417dcecc7f2b0006e%22%20font-size%3D%2213%22%20text-anchor%3D%22middle%22%20x%3D%2250.5%22%20y%3D%228%22%3E%26%23x23AF%3B%3C%2Ftext%3E%3Ctext%20font-family%3D%22horizontalbf65417dcecc7f2b0006e%22%20font-size%3D%2213%22%20text-anchor%3D%22middle%22%20x%3D%2254.5%22%20y%3D%228%22%3E%26%23x23AF%3B%3C%2Ftext%3E%3Ctext%20font-family%3D%22horizontalbf65417dcecc7f2b0006e%22%20font-size%3D%2213%22%20text-anchor%3D%22middle%22%20x%3D%2258.5%22%20y%3D%228%22%3E%26%23x23AF%3B%3C%2Ftext%3E%3Ctext%20font-family%3D%22horizontalbf65417dcecc7f2b0006e%22%20font-size%3D%2213%22%20text-anchor%3D%22middle%22%20x%3D%2262.5%22%20y%3D%228%22%3E%26%23x23AF%3B%3C%2Ftext%3E%3Ctext%20font-family%3D%22Times%20New%20Roman%22%20font-size%3D%2218%22%20font-style%3D%22italic%22%20text-anchor%3D%22middle%22%20x%3D%2250.5%22%20y%3D%2222%22%3EX%3C%2Ftext%3E%3Ctext%20font-family%3D%22Times%20New%20Roman%22%20font-size%3D%2213%22%20text-anchor%3D%22middle%22%20x%3D%2261.5%22%20y%3D%2230%22%3E1%3C%2Ftext%3E%3Ctext%20font-family%3D%22math192fcdfbcdc53f7ff438a9b94ac%22%20font-size%3D%2216%22%20text-anchor%3D%22middle%22%20x%3D%2273.5%22%20y%3D%2222%22%3E%26%23x2212%3B%3C%2Ftext%3E%3Ctext%20font-family%3D%22horizontalbf65417dcecc7f2b0006e%22%20font-size%3D%2213%22%20text-anchor%3D%22middle%22%20x%3D%2284.5%22%20y%3D%228%22%3E%26%23x23AF%3B%3C%2Ftext%3E%3Ctext%20font-family%3D%22horizontalbf65417dcecc7f2b0006e%22%20font-size%3D%2213%22%20text-anchor%3D%22middle%22%20x%3D%2288.5%22%20y%3D%228%22%3E%26%23x23AF%3B%3C%2Ftext%3E%3Ctext%20font-family%3D%22horizontalbf65417dcecc7f2b0006e%22%20font-size%3D%2213%22%20text-anchor%3D%22middle%22%20x%3D%2292.5%22%20y%3D%228%22%3E%26%23x23AF%3B%3C%2Ftext%3E%3Ctext%20font-family%3D%22horizontalbf65417dcecc7f2b0006e%22%20font-size%3D%2213%22%20text-anchor%3D%22middle%22%20x%3D%2296.5%22%20y%3D%228%22%3E%26%23x23AF%3B%3C%2Ftext%3E%3Ctext%20font-family%3D%22horizontalbf65417dcecc7f2b0006e%22%20font-size%3D%2213%22%20text-anchor%3D%22middle%22%20x%3D%22100.5%22%20y%3D%228%22%3E%26%23x23AF%3B%3C%2Ftext%3E%3Ctext%20font-family%3D%22Times%20New%20Roman%22%20font-size%3D%2218%22%20font-style%3D%22italic%22%20text-anchor%3D%22middle%22%20x%3D%2288.5%22%20y%3D%2222%22%3EX%3C%2Ftext%3E%3Ctext%20font-family%3D%22Times%20New%20Roman%22%20font-size%3D%2213%22%20text-anchor%3D%22middle%22%20x%3D%2299.5%22%20y%3D%2230%22%3E2%3C%2Ftext%3E%3Cpolyline%20fill%3D%22none%22%20points%3D%2214%2C-59%2013%2C-59%206%2C0%202%2C-23%22%20stroke%3D%22%23000000%22%20stroke-linecap%3D%22square%22%20stroke-width%3D%221%22%20transform%3D%22translate(27.5%2C99.5)%22%2F%3E%3Cpolyline%20fill%3D%22none%22%20points%3D%226%2C0%202%2C-23%201%2C-20%22%20stroke%3D%22%23000000%22%20stroke-linecap%3D%22square%22%20stroke-width%3D%221%22%20transform%3D%22translate(27.5%2C99.5)%22%2F%3E%3Cline%20stroke%3D%22%23000000%22%20stroke-linecap%3D%22square%22%20stroke-width%3D%221%22%20x1%3D%2241.5%22%20x2%3D%22119.5%22%20y1%3D%2240.5%22%20y2%3D%2240.5%22%2F%3E%3Cline%20stroke%3D%22%23000000%22%20stroke-linecap%3D%22square%22%20stroke-width%3D%221%22%20x1%3D%2245.5%22%20x2%3D%2269.5%22%20y1%3D%2272.5%22%20y2%3D%2272.5%22%2F%3E%3Ctext%20font-family%3D%22Times%20New%20Roman%22%20font-size%3D%2218%22%20font-style%3D%22italic%22%20text-anchor%3D%22middle%22%20x%3D%2254.5%22%20y%3D%2258%22%3ES%3C%2Ftext%3E%3Ctext%20font-family%3D%22Times%20New%20Roman%22%20font-size%3D%2213%22%20text-anchor%3D%22middle%22%20x%3D%2263.5%22%20y%3D%2267%22%3E1%3C%2Ftext%3E%3Ctext%20font-family%3D%22Times%20New%20Roman%22%20font-size%3D%2213%22%20text-anchor%3D%22middle%22%20x%3D%2263.5%22%20y%3D%2253%22%3E2%3C%2Ftext%3E%3Ctext%20font-family%3D%22Times%20New%20Roman%22%20font-size%3D%2218%22%20font-style%3D%22italic%22%20text-anchor%3D%22middle%22%20x%3D%2253.5%22%20y%3D%2290%22%3EN%3C%2Ftext%3E%3Ctext%20font-family%3D%22Times%20New%20Roman%22%20font-size%3D%2213%22%20text-anchor%3D%22middle%22%20x%3D%2264.5%22%20y%3D%2298%22%3E1%3C%2Ftext%3E%3Ctext%20font-family%3D%22math192fcdfbcdc53f7ff438a9b94ac%22%20font-size%3D%2216%22%20text-anchor%3D%22middle%22%20x%3D%2280.5%22%20y%3D%2279%22%3E%2B%3C%2Ftext%3E%3Cline%20stroke%3D%22%23000000%22%20stroke-linecap%3D%22square%22%20stroke-width%3D%221%22%20x1%3D%2291.5%22%20x2%3D%22115.5%22%20y1%3D%2272.5%22%20y2%3D%2272.5%22%2F%3E%3Ctext%20font-family%3D%22Times%20New%20Roman%22%20font-size%3D%2218%22%20font-style%3D%22italic%22%20text-anchor%3D%22middle%22%20x%3D%22100.5%22%20y%3D%2258%22%3ES%3C%2Ftext%3E%3Ctext%20font-family%3D%22Times%20New%20Roman%22%20font-size%3D%2213%22%20text-anchor%3D%22middle%22%20x%3D%22109.5%22%20y%3D%2267%22%3E2%3C%2Ftext%3E%3Ctext%20font-family%3D%22Times%20New%20Roman%22%20font-size%3D%2213%22%20text-anchor%3D%22middle%22%20x%3D%22109.5%22%20y%3D%2253%22%3E2%3C%2Ftext%3E%3Ctext%20font-family%3D%22Times%20New%20Roman%22%20font-size%3D%2218%22%20font-style%3D%22italic%22%20text-anchor%3D%22middle%22%20x%3D%2299.5%22%20y%3D%2290%22%3EN%3C%2Ftext%3E%3Ctext%20font-family%3D%22Times%20New%20Roman%22%20font-size%3D%2213%22%20text-anchor%3D%22middle%22%20x%3D%22110.5%22%20y%3D%2298%22%3E2%3C%2Ftext%3E%3Ctext%20font-family%3D%22math192fcdfbcdc53f7ff438a9b94ac%22%20font-size%3D%2216%22%20text-anchor%3D%22middle%22%20x%3D%22132.5%22%20y%3D%2242%22%3E%3D%3C%2Ftext%3E%3Cline%20stroke%3D%22%23000000%22%20stroke-linecap%3D%22square%22%20stroke-width%3D%221%22%20x1%3D%22143.5%22%20x2%3D%22169.5%22%20y1%3D%2235.5%22%20y2%3D%2235.5%22%2F%3E%3Ctext%20font-family%3D%22Times%20New%20Roman%22%20font-size%3D%2218%22%20text-anchor%3D%22middle%22%20x%3D%22157.5%22%20y%3D%2228%22%3E13%3C%2Ftext%3E%3Ctext%20font-family%3D%22Times%20New%20Roman%22%20font-size%3D%2218%22%20text-anchor%3D%22middle%22%20x%3D%22149.5%22%20y%3D%2253%22%3E3%3C%2Ftext%3E%3Ctext%20font-family%3D%22math192fcdfbcdc53f7ff438a9b94ac%22%20font-size%3D%2216%22%20text-anchor%3D%22middle%22%20x%3D%22156.5%22%20y%3D%2253%22%3E.%3C%2Ftext%3E%3Ctext%20font-family%3D%22Times%20New%20Roman%22%20font-size%3D%2218%22%20text-anchor%3D%22middle%22%20x%3D%22163.5%22%20y%3D%2253%22%3E4%3C%2Ftext%3E%3C%2Fsvg%3E)