1
1 mark
Identify one landform caused by mass movement.
Was this exam question helpful?
Exam code: 8GE0
Identify one landform caused by mass movement.
Was this exam question helpful?
Explain two parts of a coastal sediment cell system.
Was this exam question helpful?
Explain how transport and deposition processes produce distinctive coastal landforms.
Was this exam question helpful?
Study Figure 6 below.
A group of students were preparing to collect fieldwork data about the movement of coastal sediment in Cornwall, SW England.
As part of their preparations they consulted a website that showed data about the typical wind direction at their fieldwork location for one month.
This data was presented on a rose diagram, shown below.
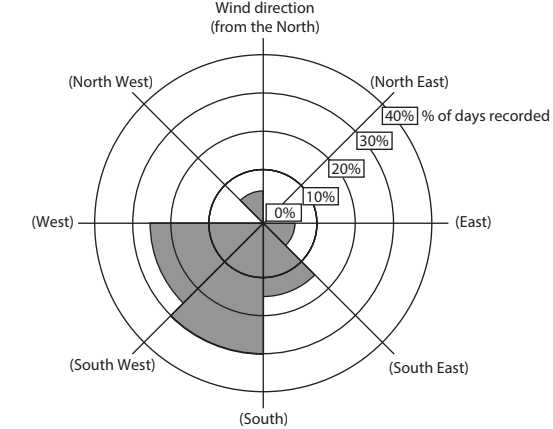
Figure 6
Wind directions in one month in Cornwall
Complete the rose diagram above to show the % of days that the wind came from W-NW using data in the table below.
Wind direction | % of days recorded |
|---|---|
W-NW | 20% |
Identify the category that is the dominant wind direction.
S-SW
E-SE
W-NW
NW-N
Identify the most suitable statistical technique to test if there is a significant difference between the observed and expected number of days that wind came from a particular direction.
Chi-squared
Lorenz curve
Spearman’s rank
T-test
Suggest a suitable hypothesis or key question that the students could investigate.
The students then planned to collect primary fieldwork about coastal sediment in the surrounding area.
Explain two primary fieldwork methods that could be used to extend this investigation.
Was this exam question helpful?
Study Figures 7a, 7b, 7c and 7d
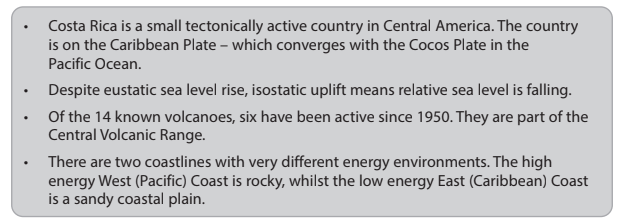
Figure 7a
Information about the two coastlines of Costa Rica
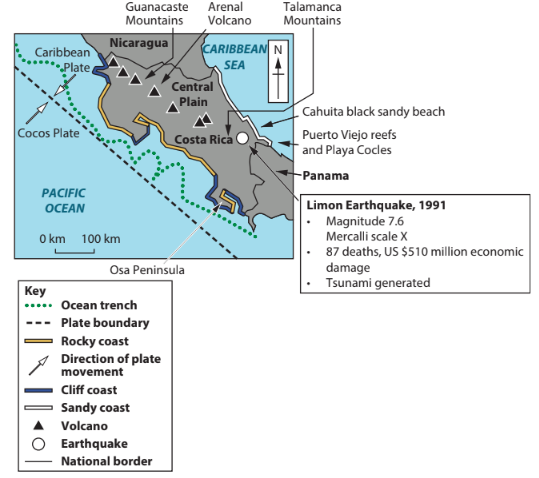
Figure 7b
Tectonic and coastal features of Costa Rica
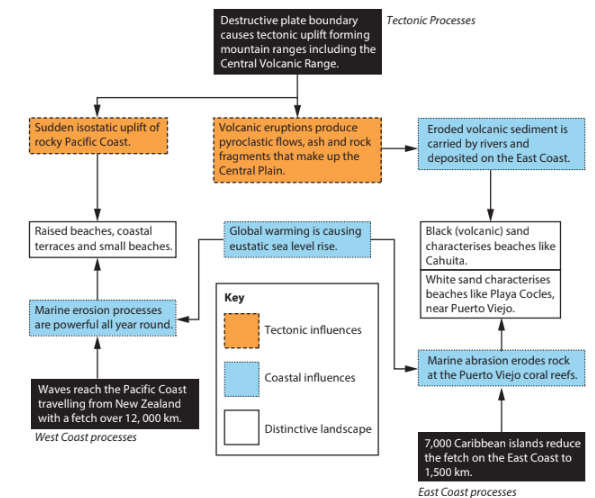
Figure 7c
Flow chart showing the interactions between coastal
and tectonic processes in Costa Rica
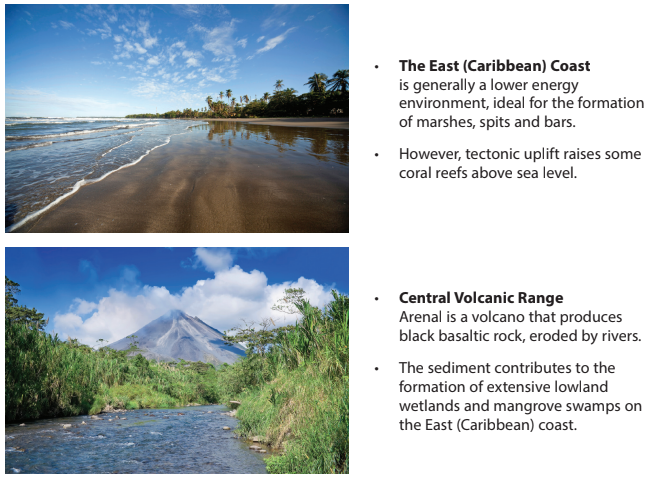
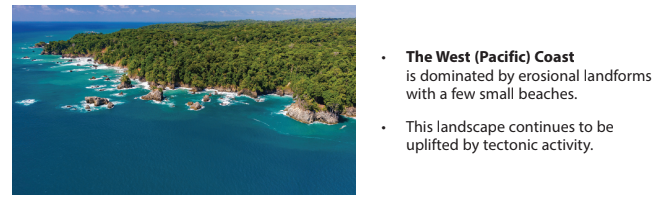
Figure 7d
Three landscapes from Costa Rica
Evaluate the extent to which the distinctive coastal landscape of Costa Rica is caused by tectonic activity.
Was this exam question helpful?
Study Figure 4
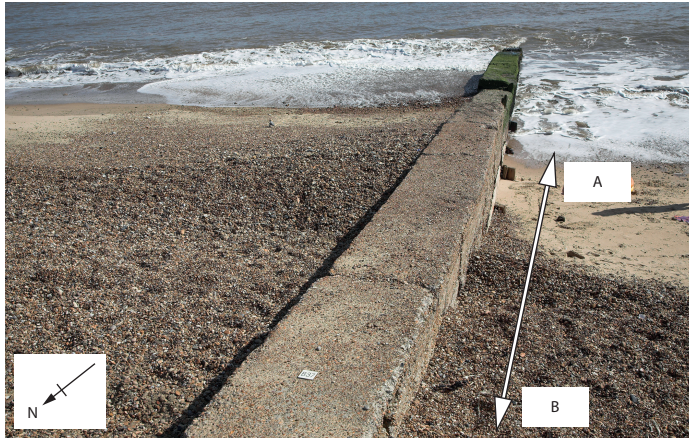
Figure 4
The beach either side of a concrete groyne at Felixstowe, Suffolk
Describe the direction of sediment transport in Figure 4.
Suggest one reason for the change in sediment size along transect AB shown in Figure 4.
Was this exam question helpful?
Assess the extent to which transport and deposition processes are more important than erosional processes in creating distinctive coastal landscapes.
Was this exam question helpful?
A group of students collected fieldwork data about cliff profiles at 15 different locations along a section of the north Cornwall coastline.
Study Figure 7
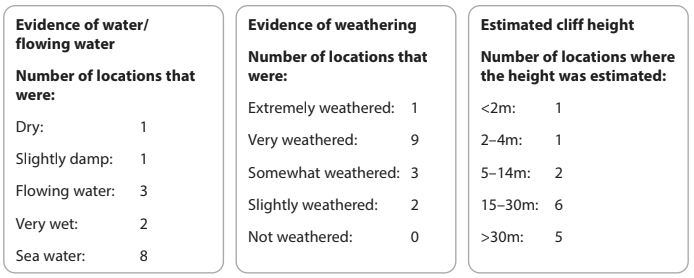
Figure 7
Collated data collection sheets from group fieldwork in an
active coastal landscape in Cornwall
Identify the modal class for the evidence of weathering.
The students then critically reflected on the methods that they used to collect their fieldwork data.
Explain two ways the data collection methods could be improved.
Was this exam question helpful?
Using a named example, explain the sediment cell concept.
Named example:
Was this exam question helpful?
Study Figure 6
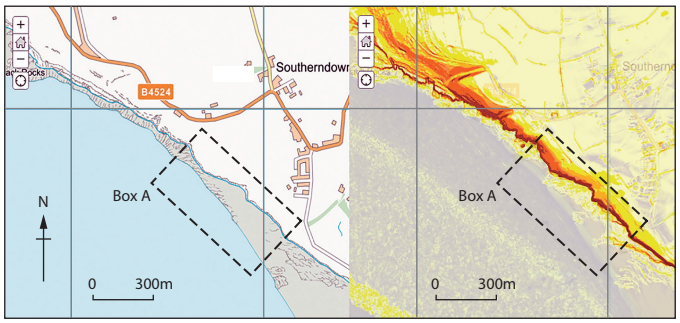
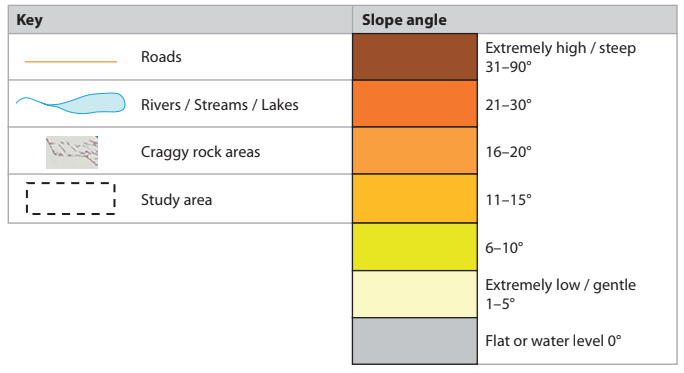
Figure 6
Geographic Information System (GIS) maps showing slope angle
around Southerndown, Glamorgan Heritage Coast, Wales
A group of students used GIS to find secondary information about the relief of the Glamorgan Heritage Coast in South Wales in order to help plan their fieldwork investigation into coastal landscapes.
Identify one coastal landform shown in box A.
Describe the angle of slope the students might expect to find at this stretch of coastline.
Was this exam question helpful?
You have carried out primary fieldwork to investigate coastal landscapes and change.
Assess the effectiveness of the techniques you used to present and analyse your fieldwork data.
Geographical enquiry question:
Was this exam question helpful?
Identify the factor which affects the direction of coastal sediment movement.
Wave type
Longshore drift
Sediment cell
Sediment shape
Was this exam question helpful?
Complete A and B in Figure 5a below.
Figure 5a
Coastal sediment system
Was this exam question helpful?
Explain two processes of weathering on a coastline.
Was this exam question helpful?
Study Figure 6a below.
A group of students used data about sediment size, from samples taken from four sites along the south coast of England, as part of an investigation about spit formation.
Beach site | Site 1 | Site 2 | Site 3 | Site 4 |
|---|---|---|---|---|
Number of pebbles > 5mm | 27 | 20 | 12 | 5 |
Figure 6a
State one reason for studying sediment size.
Study Figure 6b below.
The students carried out a Chi2 test to determine if there was any pattern in the distribution of pebble sizes > 5mm.
The formula for Chi2 (X2) is:
![]()
![]()
Beach site | Site 1 | Site 2 | Site 3 | Site 4 |
|---|---|---|---|---|
Observed (O) | 28 | 20 | 11 | 5 |
Expected (E) | 16 | 16 | 16 | 16 |
(O − E)2 | 144 | 16 | 121 | |
(O − E)2/E | 9 | 1 | 1.6 | 7.6 |
Figure 6b
Complete the table above by calculating the missing number in the Site 3 column.
Calculate the value of Chi2(X2) for the data given.
Chi2 (X2)= ...............................
Suggest one reason for carrying out a Chi2 (X2)test on this data set.
Explain two primary fieldwork methods that might have been used to extend this investigation on spit formation.
Was this exam question helpful?
You have carried out primary fieldwork to investigate coastal landscapes and change.
Assess how the sampling procedures and sample size affected your results.
Geographical enquiry question:
Was this exam question helpful?
State one process of mass movement that occurs in coastal landscapes.
Was this exam question helpful?
Study Figure 6
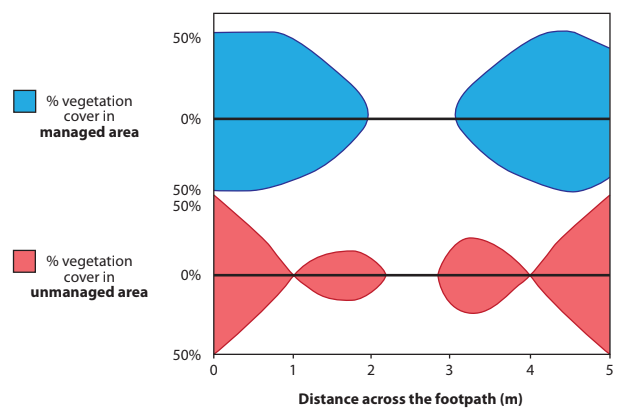
Figure 6
Kite diagrams showing footpath erosion in two areas
of sand dunes at Studland Bay, Dorset
A group of students collected data about footpath erosion at Studland Bay, a sand dune coastline in Southern England.
They measured vegetation cover across a transect on:
1. a managed footpath
2. an unmanaged footpath.
They presented their findings as two kite diagrams.
Identify one qualitative method the students might use to compare these two transects.
Was this exam question helpful?
You have carried out primary fieldwork to investigate coastal landscapes and change.
Assess the accuracy and reliability of the primary data that you collected as part of your geographical investigation.
Geographical enquiry question:
Was this exam question helpful?