Demographic & Cultural Tensions (Edexcel AS Geography): Exam Questions

Exam code: 8GE0

1 hour13 questions
1
3 marks

Study Figure 5.

Street view with diverse shops featuring cultural clothing and goods; vibrant pedestrian activity. Stats: 209 shops, 1,120 employees, 74% ethnic-themed.

Figure 5
The Broadway, Southall, London, a high street that has changed due to
international migration

Suggest one way migration flows have changed the culture of areas like The Broadway, Southall.

2
6 marks

Explain why changes to the built environment in diverse places may create challenges for some groups of people.

3
16 marks

Study Figures 7a, 7b, 7c and 7d .

Text describing Kingston's migration history, impact of skilled migrants, remittances, and economic growth, with 84% of migrants being professionals.

Figure 7a
Information about migration to and from Kingston and Jamaica

Facts about migration and the economy in Kingston and Jamaica

Figure 7b
Facts about migration and the economy in Kingston and Jamaica

Opinions about migration in Kingston

Figure 7c
Opinions about migration in Kingston

A group of young people, wearing masks, distribute food parcels in a rundown urban area, supporting the elderly in Kingston.
A diverse group of students engaged in discussion in a classroom at Kingston University, sitting in a circle with notebooks on their laps.

Figure 7d
People in Kingston affected by international migration

Evaluate the extent to which international migration brings benefits for both migrants and their families in Kingston, Jamaica.

4
3 marks

Study Figure 5b.

Map of East London showing language dominance: Lithuanian, Bengali, and Nepali. Areas include Beckton, Silvertown, Woolwich. Displays roads and River Thames.

Figure 5b
Distribution of Lithuanian, Bengali and Nepali speakers in east London, 2019

Suggest one reason for the distribution of Lithuanian speakers.

5
4 marks

Explain two changes in UK culture resulting from migration from either former colonies or the European Union.

6
16 marks

Study Figures 7a, 7b, 7c and 7d.
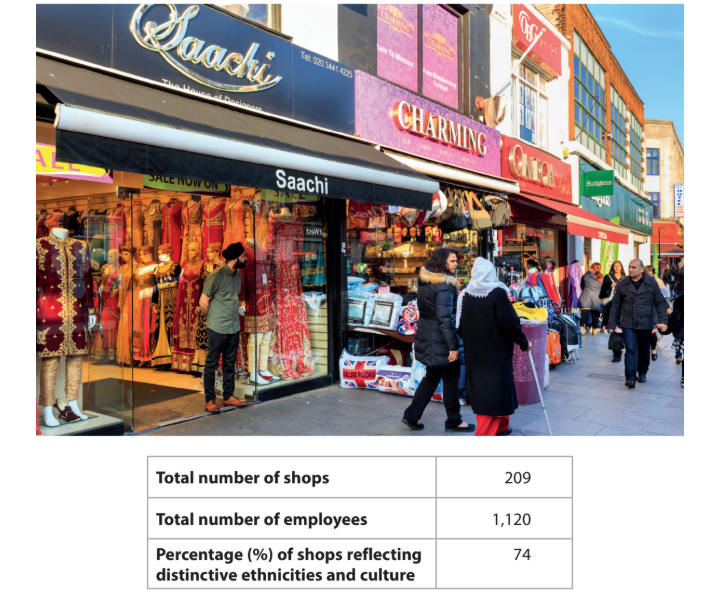
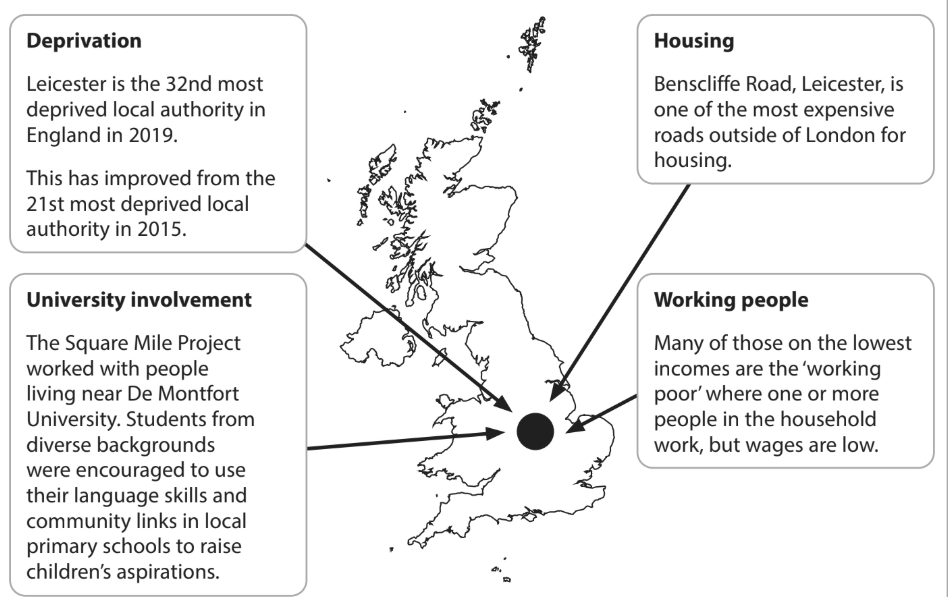
Text listing Leicester's migration history, factory shifts, illegal employment, diversity, recent ethnic tensions, and local political representation.

Figure 7a
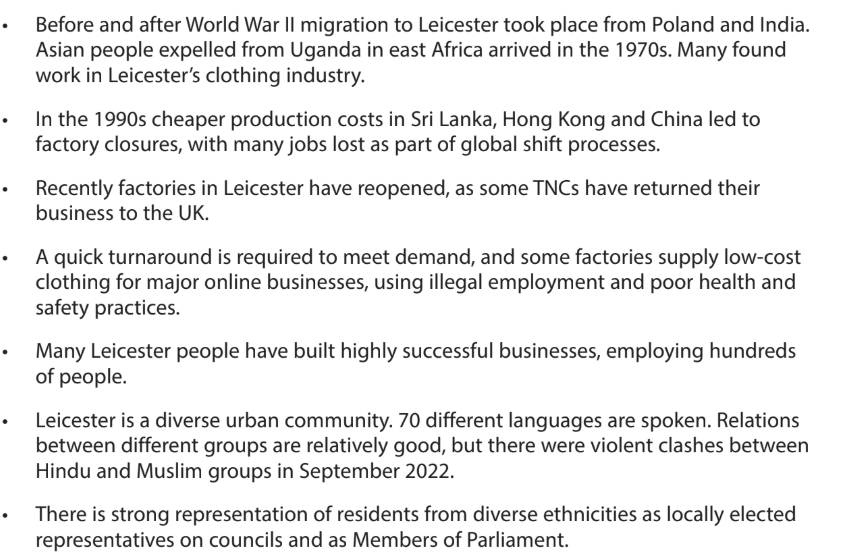
Background information about Leicester, East Midlands, UK
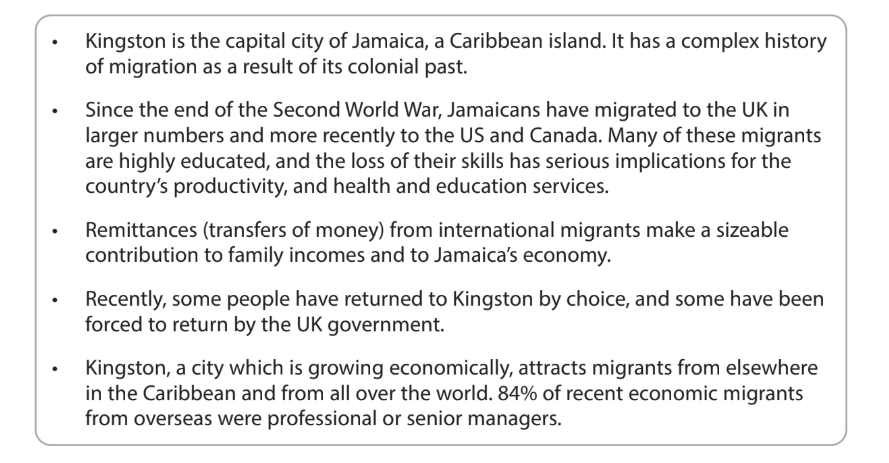
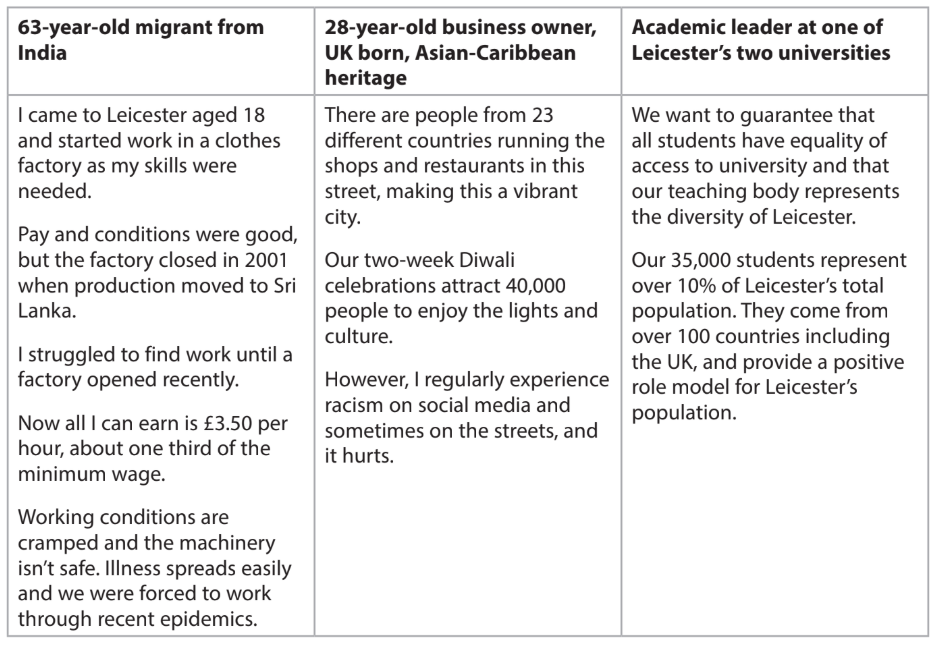
Map of the UK with text boxes about Leicester: deprivation ranking, university project, expensive Benscliffe Road housing, and low-income working people.

Figure 7b
Contrasting life experiences in Leicester
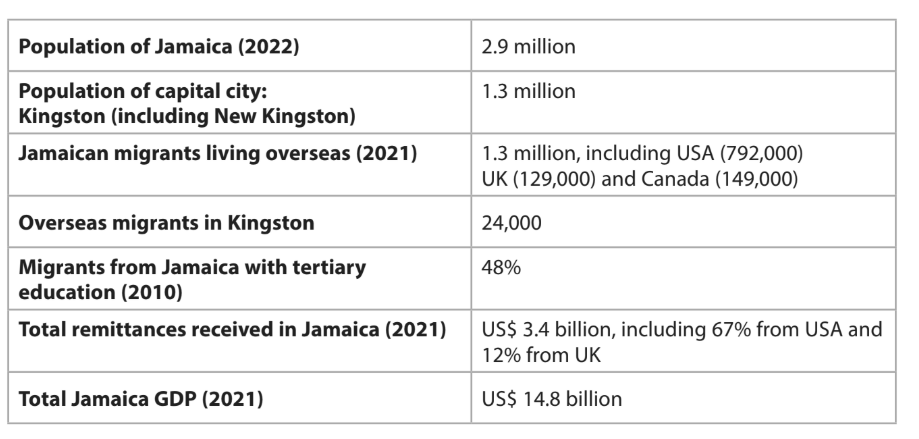
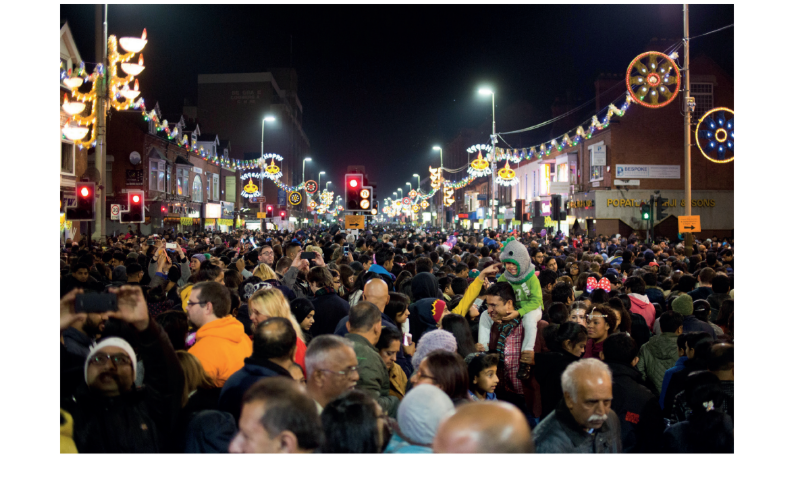
Table with three columns: migrant's work struggles, business owner's cultural perspective, and academic leader's view on diversity in Leicester.

Figure 7c
Quotes from residents of Leicester
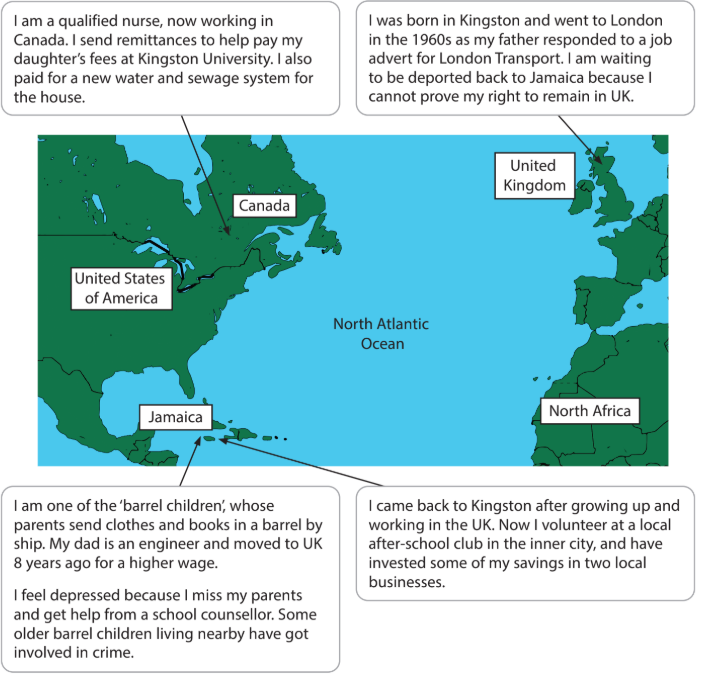
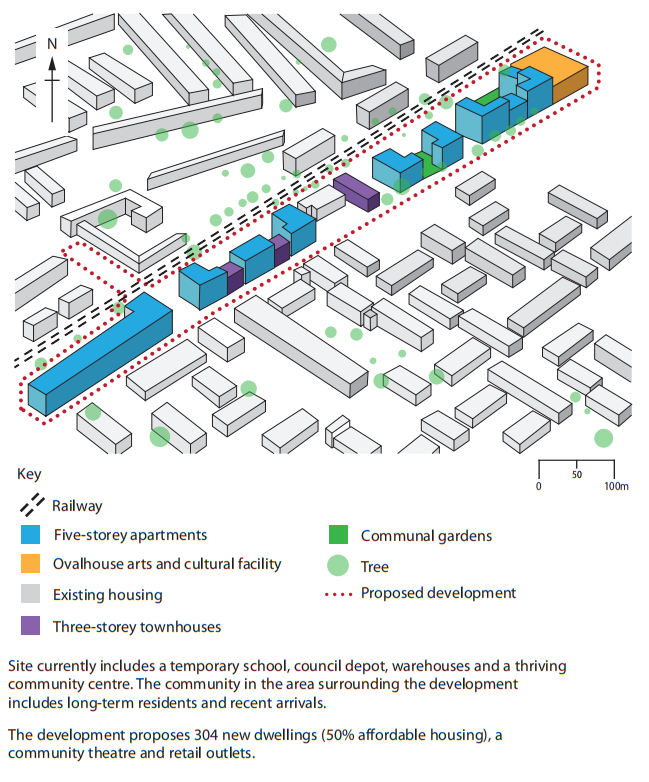
A bustling night street festival with a large crowd and vibrant hanging lights, people taking photos, and festive decorations above.

Figure 7d
Popular Diwali celebrations in Leicester attract visitors from the whole region, and are amongst the largest outside of India

Migration and global changes in the manufacturing industry have shaped the city of Leicester.

Evaluate the extent to which international influences have benefited the businesses and people of Leicester.

7
1 mark

Define the term ‘lived experience of a place’.

8
1 mark

Explain two reasons why people’s age affects their view of a local place you have studied.

9
12 marks

Assess why conflicts may occur between stakeholders involved in demographic and cultural change.

10
3 marks
Map of Beckton, Silvertown, and Woolwich around the River Thames, showing areas with Lithuanian, Bengali, and Nepali language speakers.

Figure 5
Somerleyton Road development, Brixton, inner city London

Suggest one reason local people may object to this development.

11
4 marks

Explain two changes to UK culture as a result of migration from the European Union (EU).

12
6 marks

Explain the factors that may result in ethnically segregated communities.

13
2 marks

Identify two hazards that should be included in a risk assessment for fieldwork in an urban location.