1
12 marks
Assess the advantages in using a range of evidence when measuring the success of the management of change in diverse communities.
Was this exam question helpful?
Exam code: 8GE0
Assess the advantages in using a range of evidence when measuring the success of the management of change in diverse communities.
Was this exam question helpful?
Students collected data about the number of pedestrians passing two locations (A and B) for one minute, at 30-minute intervals on a Monday between 8am and 12 noon. This was part of their research into the levels of deprivation in two locations. The locations were 2km apart. |
Study Figure 6
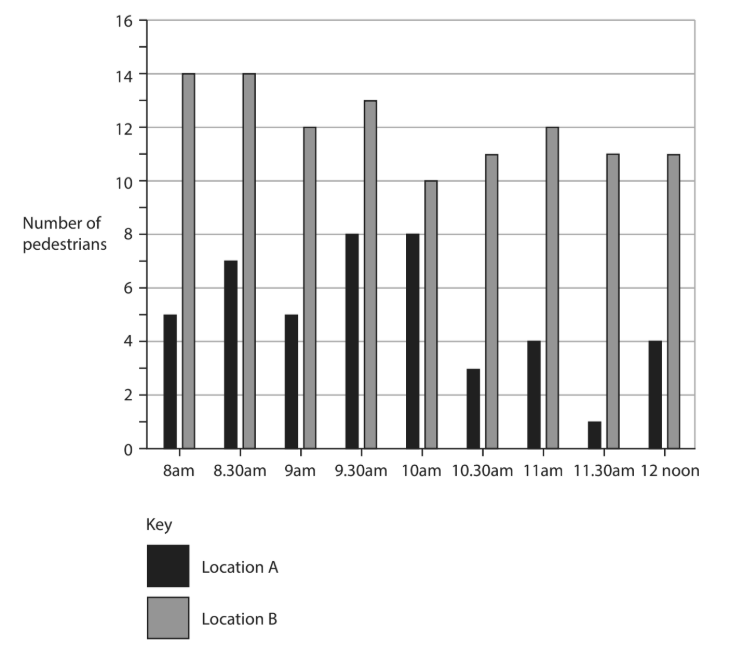
Figure 6
Pedestrians passing two locations at 30-minute intervals
between 8am and 12 noon
Suggest whether deprivation is likely to be greater at location A or B.
Explain one limitation of the design of this data collection method.
Was this exam question helpful?
You have also carried out fieldwork and research into a question about Diverse Places.
Assess how far your conclusions answered the question posed in the geographical investigation.
Geographical enquiry question:
Was this exam question helpful?
Changes in rural places may be perceived as undesirable by some people.
Assess the success of approaches to managing these changes in rural places.
Was this exam question helpful?
Study Figure 6.
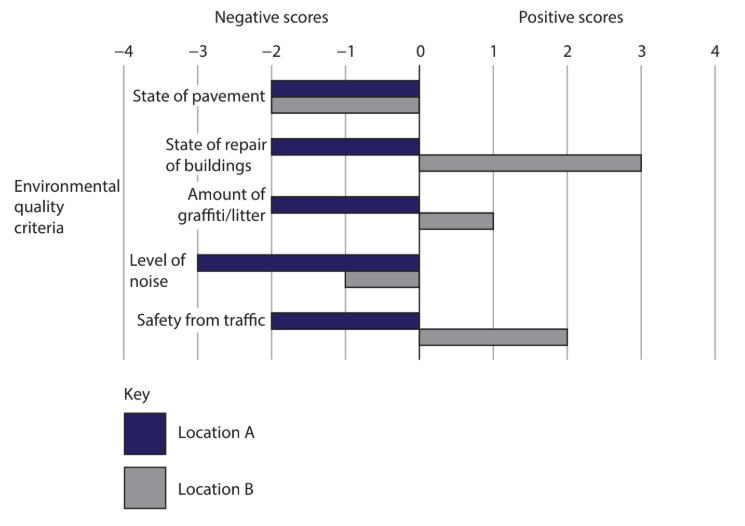
Figure 6
Environmental quality in two contrasting locations in the students’ local town
Scores range from –4 to +4, where –4 is the lowest score for each category
Students visited two locations in their local town. They completed an environmental quality survey in five streets in Location A and Location B. They then calculated the mean score for each location. |
Suggest two other criteria the students could have included in their environmental quality survey.
Was this exam question helpful?
You have also carried out fieldwork to investigate Diverse Places.
Assess the effectiveness of your data processing and presentation techniques in analysing the data you collected.
Geographical enquiry question:
Was this exam question helpful?
Explain how social progress can be measured through changes in deprivation and demographic characteristics.
Was this exam question helpful?
Study Figures 5a, 5b, 5c and 5d.

Figure 5a
Background information about East Liberty, Pittsburgh, Pennsylvania, USA
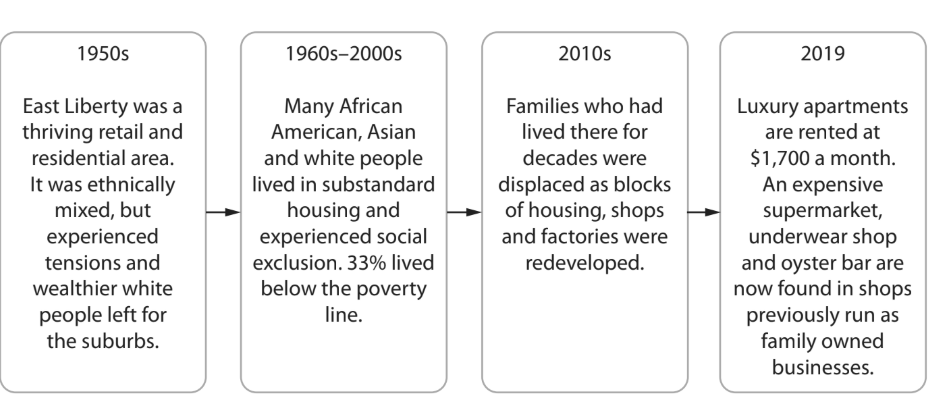
Figure 5b
Socio-economic changes in East Liberty
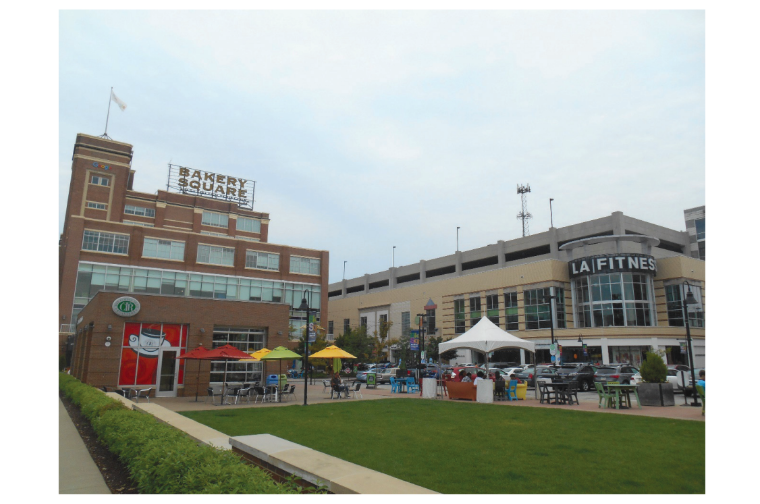
Figure 5c
Former factories in East Liberty now regenerated into a leisure space
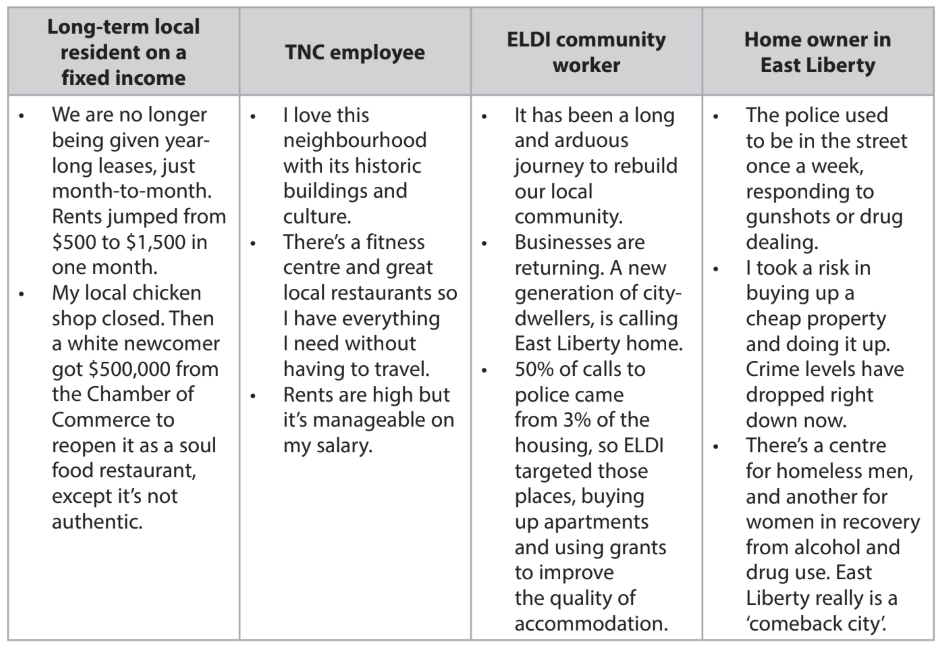
Figure 5d
Views of change in East Liberty from different stakeholders
Evaluate the extent to which stakeholders have benefited from socio-economic changes in East Liberty.
Was this exam question helpful?
Assess why stakeholders might use different criteria for judging the success of managing social tensions in EITHER urban OR rural places.
Was this exam question helpful?
Study Figure 5b.
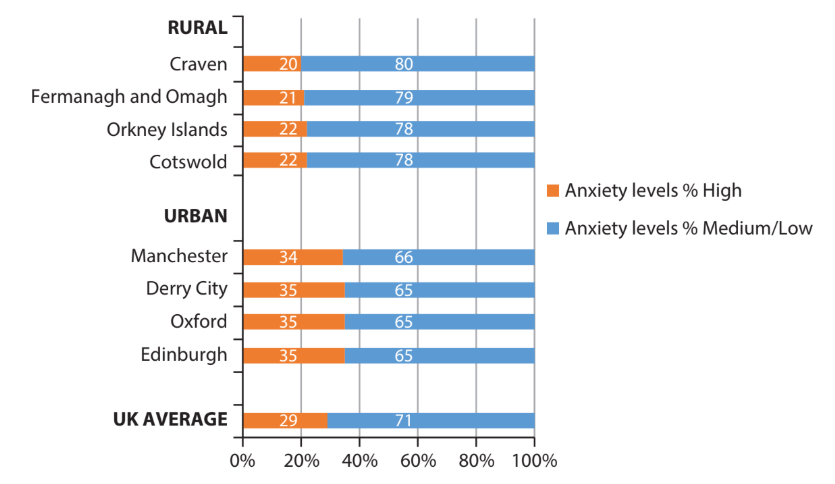
Figure 5b
Residents’ perceptions of place, measured by anxiety levels, 2016
(from a survey by the Office of National Statistics)
Suggest one reason why anxiety levels are so high in urban areas.
Was this exam question helpful?
Explain different ways of measuring the success of the management of cultural and demographic issues.
Was this exam question helpful?
Study Figures 7a, 7b, 7c and 7d.
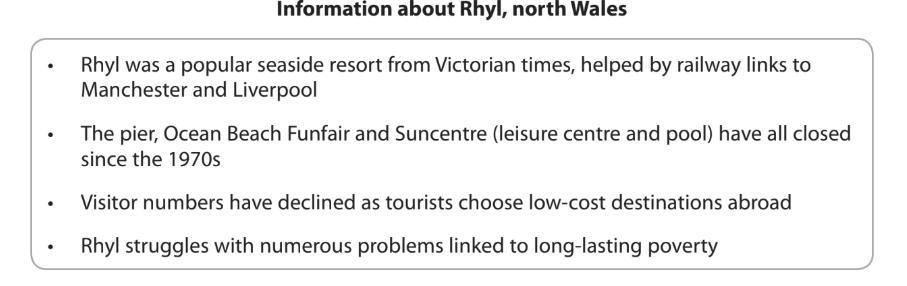
Figure 7a
Deprivation in Rhyl
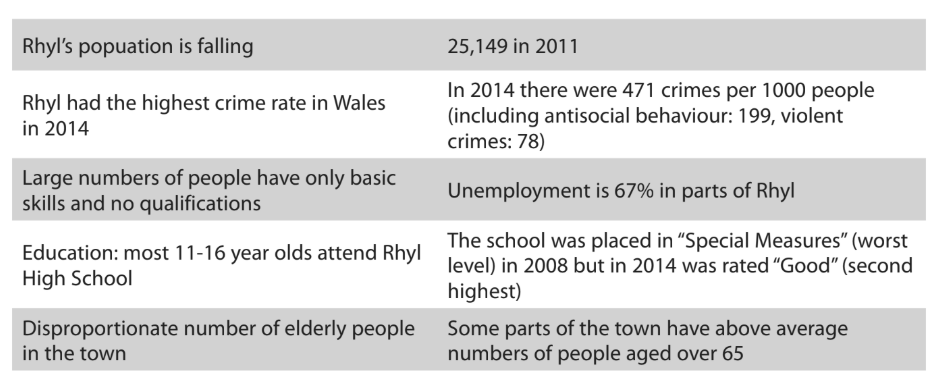
Figure 7b
Challenges faced by Rhyl
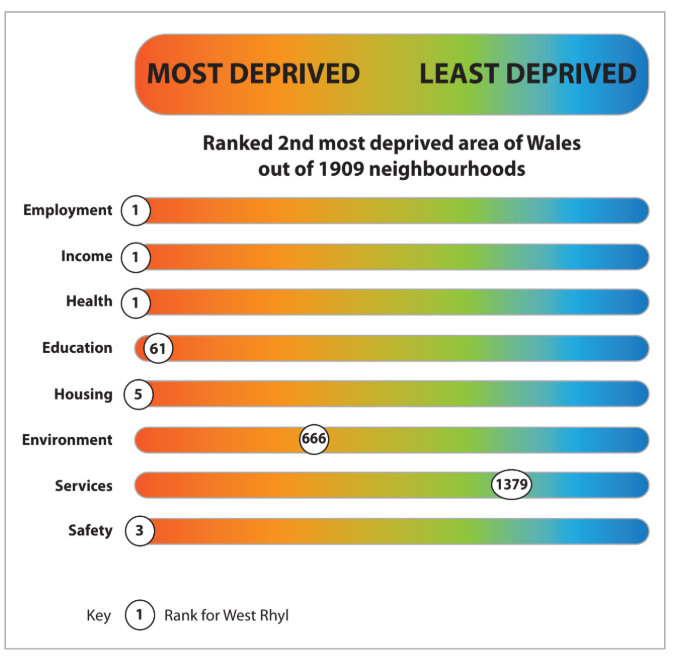
Figure 7c
Overall deprivation from Welsh Index for West Rhyl

Figure 7d
Some strategies used and planned to manage social challenges in Rhyl
Rhyl faces many challenges.
Evaluate the effectiveness of the strategies shown in meeting these.
Was this exam question helpful?