1
1 mark
Name one fluvioglacial landform.
Was this exam question helpful?
Exam code: 8GE0
Name one fluvioglacial landform.
Was this exam question helpful?
Explain two landforms that are created by valley glacier erosion.
Was this exam question helpful?
Explain how distinctive landforms are created by glacial deposition.
Was this exam question helpful?
Explain how glacial deposition landforms can help reconstruct former ice extent and movement.
Was this exam question helpful?
Assess the contribution of glacial meltwater in the formation of glaciated landscapes.
Was this exam question helpful?
Study Figure 3 below.
A group of students were preparing to collect fieldwork data about glacial landform orientation in the Scottish Highlands.
As part of their preparations they consulted previous studies about the orientations of corries.
They showed their findings on a rose diagram, shown below.
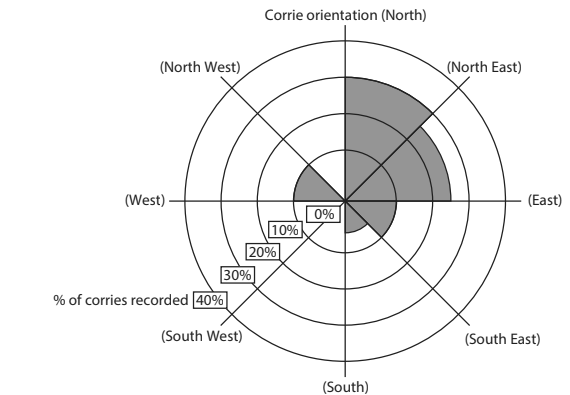
Figure 3
Corrie orientation in part of Scottish Highlands
Complete the rose diagram above to show the % of corries orientated NW-N using data in the table below.
Corrie orientation | % of corries |
|---|---|
NW-N | 20% |
Identify the category that is the dominant orientation of corries.
N-NE
E-SE
SW-W
W-NW
Identify the most suitable statistical technique to test if there is a significant difference between the observed and expected number of corries that are orientated in a particular direction.
Chi-squared
Lorenz curve
Spearman’s rank
T-test
Suggest a suitable hypothesis or key question that the students could investigate.
The students then planned to collect primary fieldwork about landform orientation in the surrounding area.
Explain two primary fieldwork methods that could be used to extend this investigation.
Was this exam question helpful?
You have carried out an investigation into glaciated landscapes and change.
Assess the value of secondary data at different stages of your geographical investigation.
Geographical enquiry question
Was this exam question helpful?
Study Figures 4a, 4b, 4c and 4d
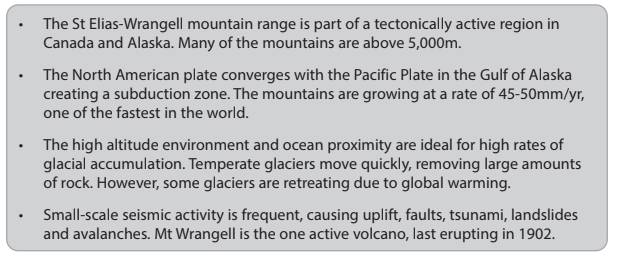
Figure 4a
Information about the St Elias-Wrangell mountain range, Alaska, USA
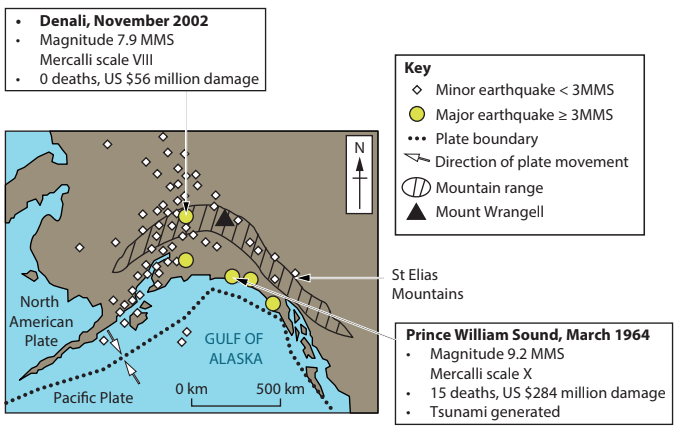
Figure 4b
Tectonic activity in the St Elias-Wrangell mountain range
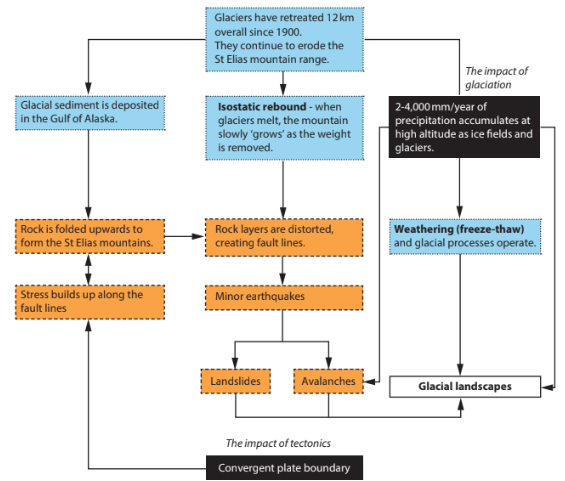
Figure 4c
Flow chart showing the interaction of tectonic and glacial processes
in the St Elias-Wrangell mountain range
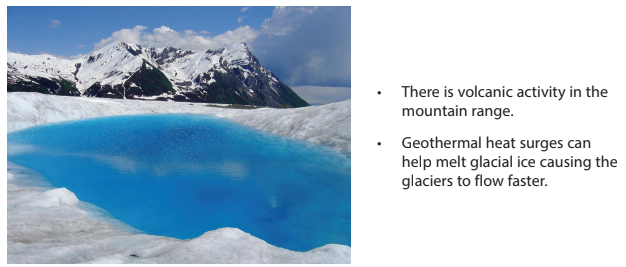
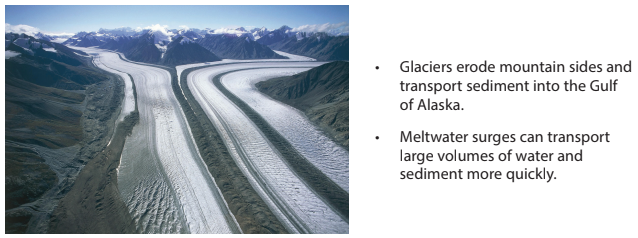
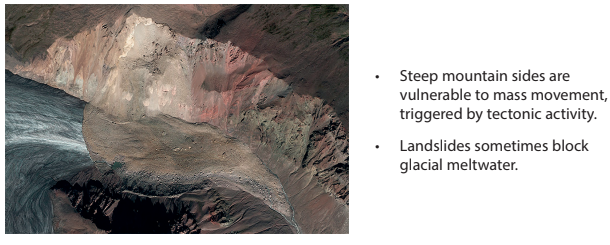
Figure 4d
Three landscapes from the St Elias-Wrangell mountain range
Evaluate the extent to which the distinctive landscape in the St Elias-Wrangell mountain range is caused by tectonic activity.
Was this exam question helpful?
Study Figure 2
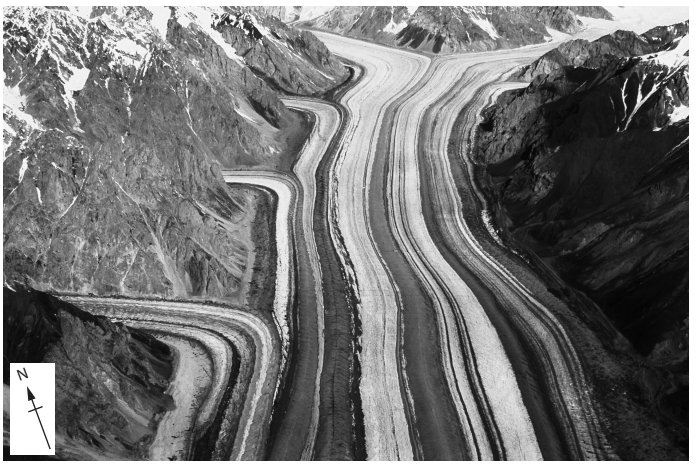
Figure 2
Aerial photo of Mt Barnard Glacier, in Alaska
Suggest one reason for the pattern of glacial moraine in Figure 2.
Was this exam question helpful?
Assess the extent to which the processes of deposition are more important than the processes of erosion in creating distinctive glacial landscapes.
Was this exam question helpful?
Study Figure 6
A group of students collected fieldwork data at 15 different locations in a fluvioglacial landscape in the Swiss Alps.
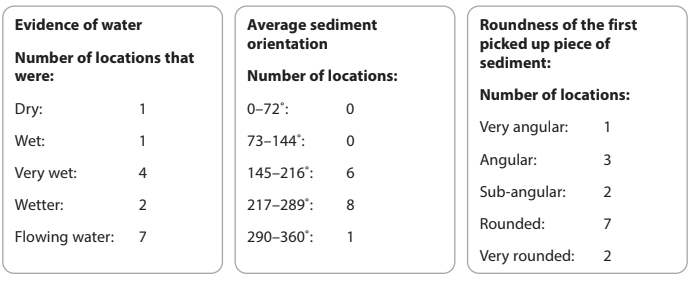
Figure 6
Collated data collection sheets from group fieldwork in an active
fluvioglacial landscape in the Swiss Alps
The students then collated their data about water and sediments.
Calculate the % of sites where flowing water was observed.
Give your answer to one decimal place.
.............................................................. %
Identify the modal class for the sediment orientation.
Was this exam question helpful?

Figure 6
Collated data collection sheets from group fieldwork in an active
fluvioglacial landscape in the Swiss Alps
The students concluded that the landscape was shaped by fluvioglacial processes.
Suggest why the primary data in Figure 6 shows that the conclusion might be a sensible one.
Was this exam question helpful?
Study Figure 3.
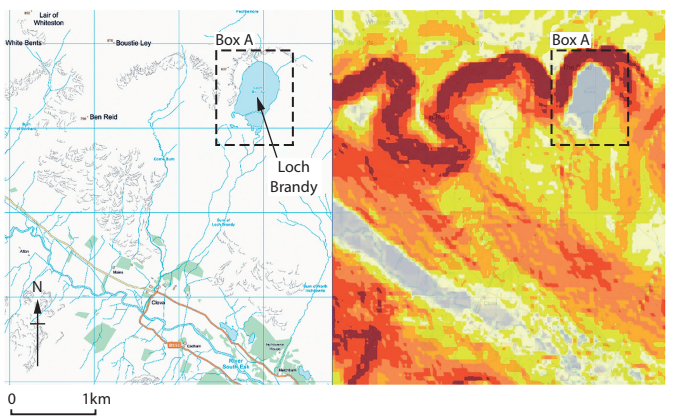
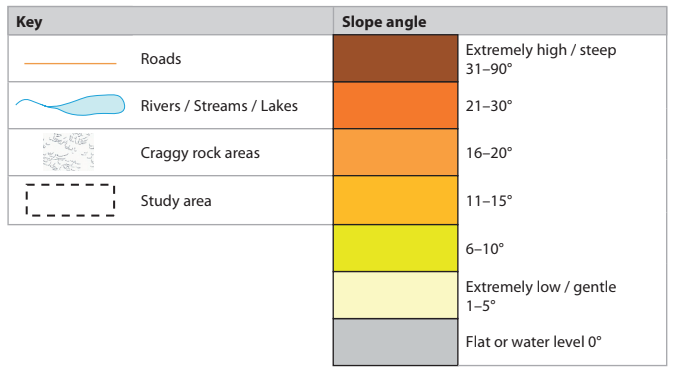
Figure 3
Geographic Information System (GIS) maps showing slope angle
around Glen Clova valley, Cairngorms National Park, Scotland
Identify the type of glaciated landform shown in box A (Loch Brandy).
Describe the angle of slope the students might expect to find around Loch Brandy.
Was this exam question helpful?
You have carried out primary fieldwork to investigate glacial landscapes and change.
Assess the effectiveness of the techniques you used to present and analyse your fieldwork data.
Geographical enquiry question:
Was this exam question helpful?
Explain two processes of water movement within glaciers.
Was this exam question helpful?
Explain how the characteristics of glacial and fluvioglacial deposits differ.
Was this exam question helpful?
Study Figure 3a below.
A group of students used secondary data about cirque/corrie orientation in Snowdonia, North Wales, as part of an investigation about ice flow direction.
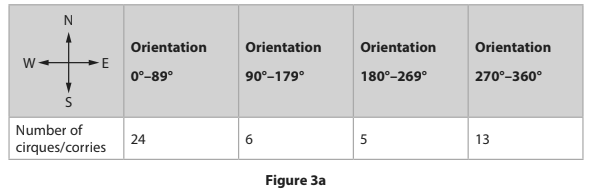
State one reason for studying cirque/corrie orientation.
Study Figure 3b below
The students carried out a Chi2 test to determine if there was any pattern in the distribution of corrie orientation.
The formula for Chi2 (X2) is:
![]()
![]()
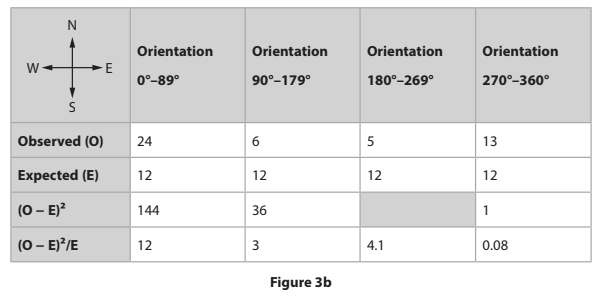
Complete the table above by calculating the missing number in the Orientation 180° – 269° column.
Calculate the value of Chi2 (X2) from the data given.
Chi2 (X2)= ...............................
Suggest one reason for carrying out a Chi2 (X2) test on this data set.
Explain two primary fieldwork methods that might have been used to extend this investigation on ice flow direction.
Was this exam question helpful?
You have carried out primary fieldwork to investigate glacial landscapes and change.
Assess how the sampling procedures and sample size affected your results.
Geographical enquiry question:
Was this exam question helpful?
Study Figure 3
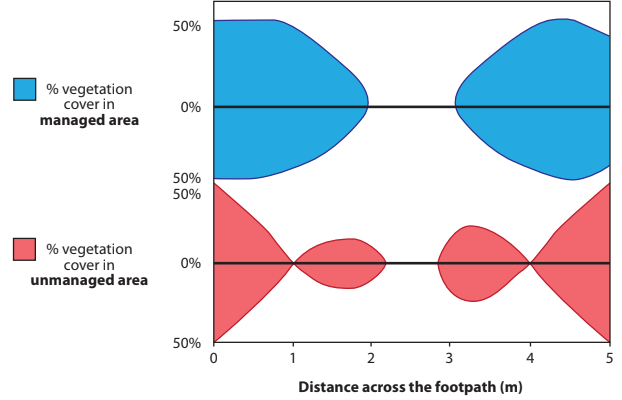
Figure 3
Kite diagrams showing footpath erosion in two areas
near Easedale Tarn, Lake District
A group of students collected data about footpath erosion near Easedale Tarn, a fragile, glaciated landscape in the Lake District.
They measured vegetation cover across a transect on:
1. a managed footpath
2. an unmanaged footpath.
They presented their findings as two kite diagrams.
Identify one qualitative method the students might use to compare these two transects.
Was this exam question helpful?
You have carried out primary fieldwork to investigate glacial landscapes and change.
Assess the accuracy and reliability of the primary data that you collected as part of your geographical investigation.
Geographical enquiry question:
Was this exam question helpful?
Study Figures 4a, 4b, 4c and 4d
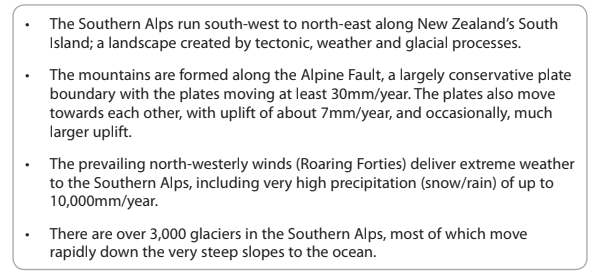
Figure 4a
Information about the Southern Alps, New Zealand
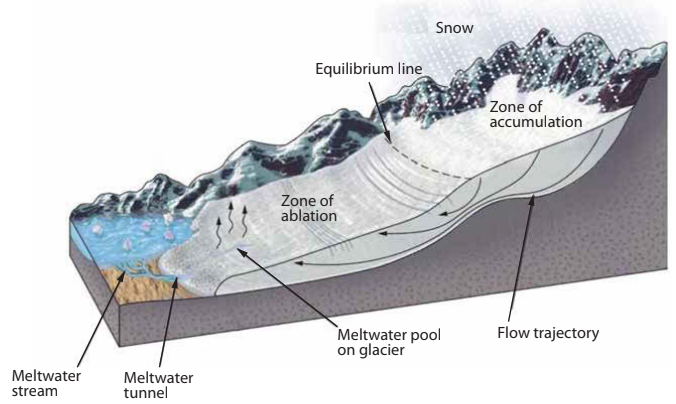
Figure 4b
A simplified cross-section from Mt. Tasman to the coast
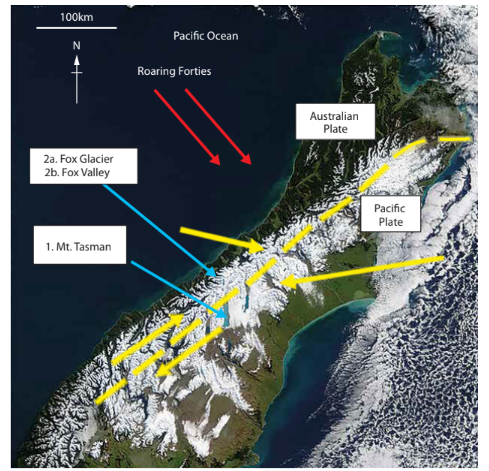
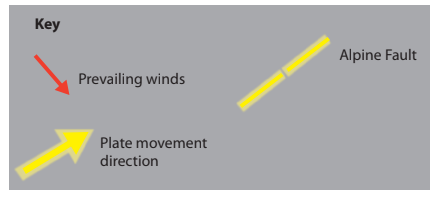
Figure 4c
Satellite image of the Southern Alps in winter
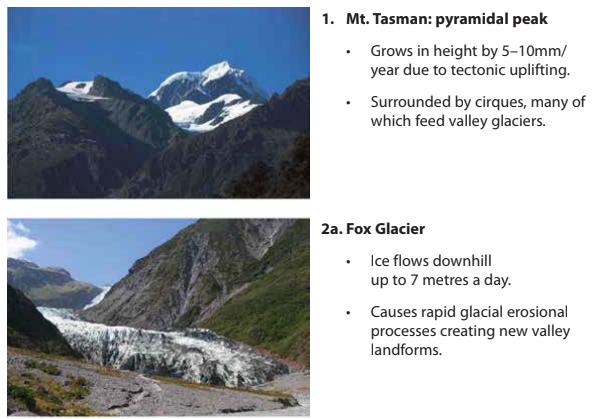
Figure 4d
Distinctive landscapes in the Southern Alps
Evaluate the importance of tectonic processes and weather conditions in creating distinctive glacial landscapes in New Zealand.
Was this exam question helpful?