1
12 marks
Assess the importance of developments in ICT (Information and Communication Technology) and mobile communication in the global spread of TNCs (Transnational Corporations).
Was this exam question helpful?
Exam code: 8GE0
Assess the importance of developments in ICT (Information and Communication Technology) and mobile communication in the global spread of TNCs (Transnational Corporations).
Was this exam question helpful?
Explain how global connections have resulted in two different types of flow between places.
Was this exam question helpful?
Explain two measures of the degree of globalisation of a country.
Was this exam question helpful?
Explain how ICT communication networks have resulted in time-space compression for most people.
Was this exam question helpful?
Identify the policy used by national governments which contributes to globalisation.
Internet censorship
Increasing tariffs
Restricting migration
Privatisation of industries
Was this exam question helpful?
Study Figure 1
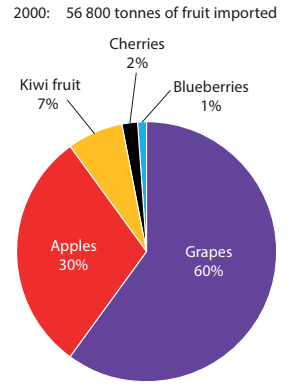
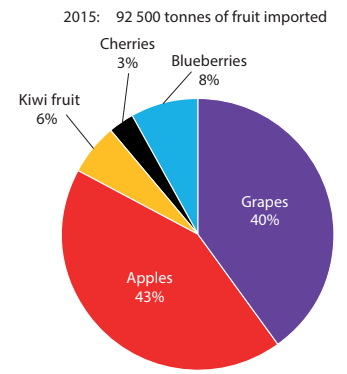
Figure 1
Fruit imports from Chile to the UK in 2000 and 2015
In 2000, 568 tonnes of blueberries were imported from Chile to the UK. This was 1% of the total fruit imports (56800 tonnes). In 2015, fruit imports rose to 92500 tonnes.
Calculate the total tonnes of blueberries imported in 2015.
.............................................................. tonnes
Calculate the increase in tonnes of blueberries imported between 2000 and 2015.
.............................................................. tonnes
Suggest one way Information and Communications Technology (ICT) accelerates food imports between countries.
Was this exam question helpful?
Explain how Transnational Corporations (TNCs) contribute to the spread of globalisation.
Was this exam question helpful?
Study Figure 1b
Year | 2000 | 2015 | 2020 (projected) |
|---|---|---|---|
Number of food outlets | 1 | 97 | 215 |
Figure 1b
Pizza Hut food outlets in Thailand, 2000 projected to 2020
Calculate the percentage increase in the projected number of food outlets from 2015 to 2020.
You must show your working.
Give your answer to the nearest whole number.
Answer ..............................................................
Was this exam question helpful?
Identify the correct category for the World Trade Organisation (WTO).
NGO (Non-Governmental Organisation)
TNC (Trans-National Corporation)
Free trade bloc
International economic organisation
Was this exam question helpful?
Study Figure 1b
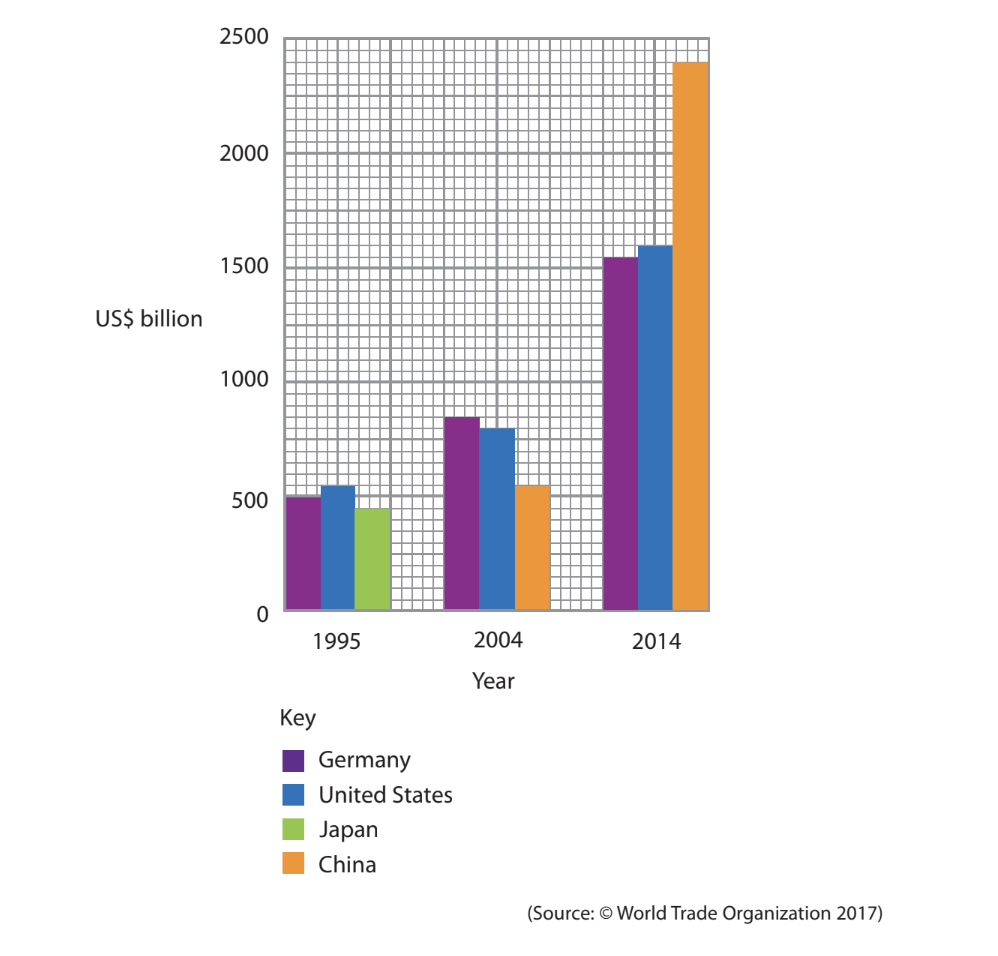
Figure 1b
World’s top exporters of goods 1995-2014
Calculate the change in China’s exports between 2004 and 2014.
.............................................................US$ billion
Suggest one development in transport that has contributed to the growth of trade shown in Figure 1b.
Was this exam question helpful?
Explain two national government policies that have assisted economic growth in some countries.
Was this exam question helpful?