1
12 marks
Assess the advantages in using a range of evidence when measuring the success of regeneration.
Was this exam question helpful?
Exam code: 8GE0
Assess the advantages in using a range of evidence when measuring the success of regeneration.
Was this exam question helpful?
Students collected data about the number of pedestrians passing two locations (A and B) for one minute, at 30-minute intervals on a Monday between 8am and 12 noon. This was part of their research into a completed regeneration project. One location was close to the completed regeneration project and the other was 2km away. |
Study Figure 3
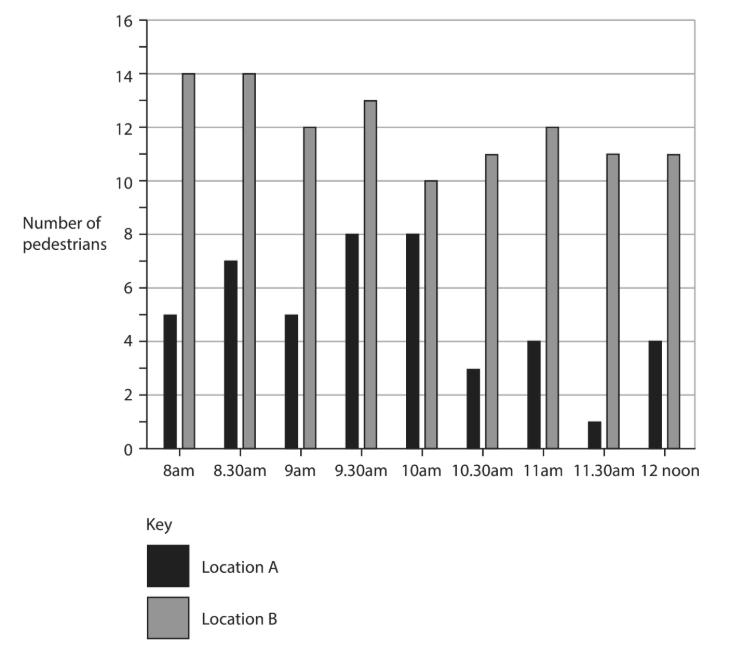
Figure 3
Pedestrians passing two locations at 30-minute intervals between 8am and 12 noon
Explain one limitation of the design of this data collection method.
Was this exam question helpful?
You have also carried out fieldwork and research into a question about Regenerating Places.
Assess how far your conclusions answered the question posed in the geographical investigation.
Geographical enquiry question:
Was this exam question helpful?
Study Figures 4a, 4b, 4c, 4d and 4e.

Figure 4a
Information about Hambantota Port, Sri Lanka
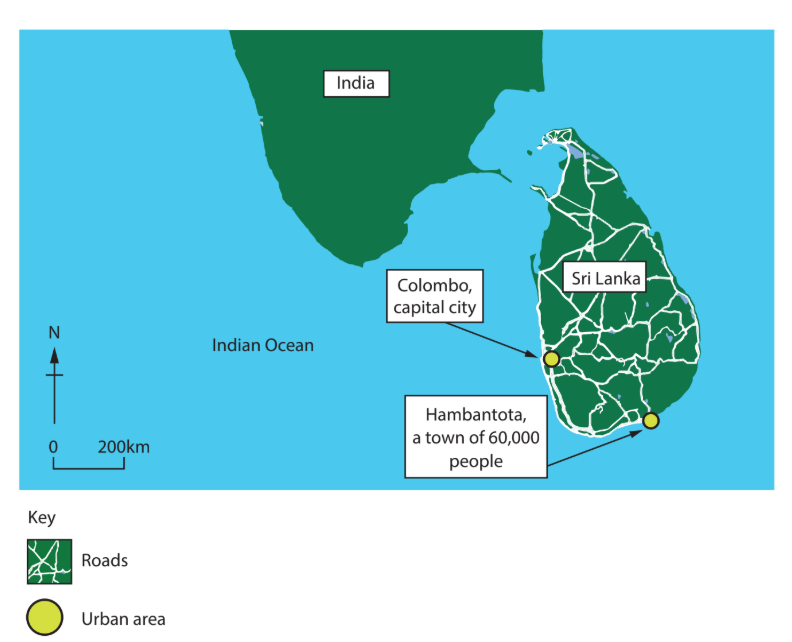
Figure 4b
Location of Hambantota, Sri Lanka
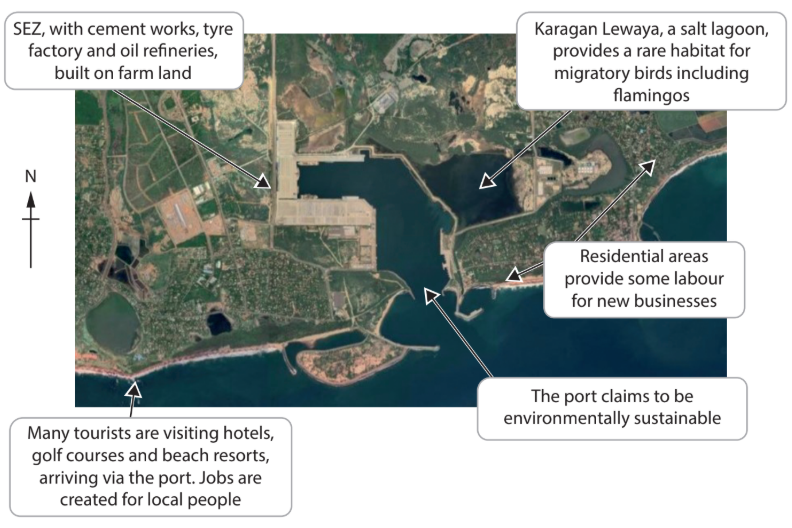
Figure 4c
Hambantota and its surrounding area
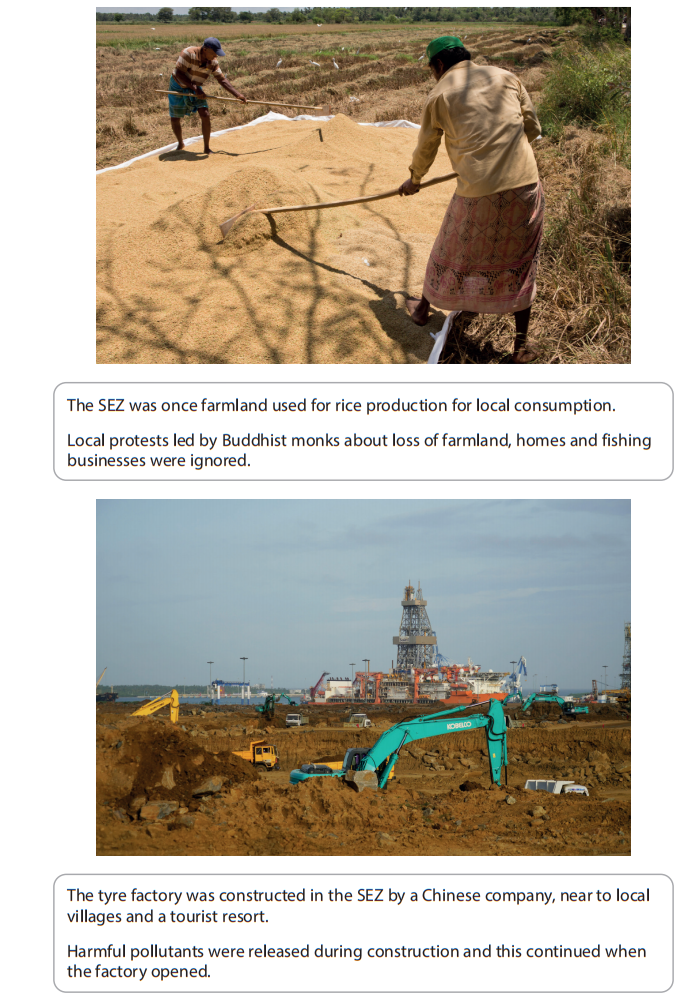
Figure 4d
Images of Hambantota, before and during the building of the SEZ
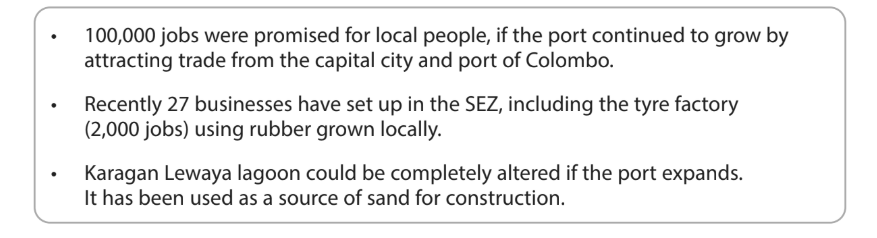
Figure 4e
Future plans and concerns for Hambantota
Evaluate the extent to which the regeneration of Hambantota port has benefited the local people and the local environment.
Was this exam question helpful?
Study Figure 3 .
Students visited two locations in their local town. They completed an environmental quality survey in five streets in Location A and Location B. They then calculated the mean score for each location. |
Compare the environmental quality in Locations A and B.
Suggest two other criteria the students could have included in their environmental quality survey.
Was this exam question helpful?
You have also carried out fieldwork to investigate Regenerating Places.
Assess the effectiveness of your data processing and presentation techniques in analysing the data you collected.
Geographical enquiry question:
Was this exam question helpful?
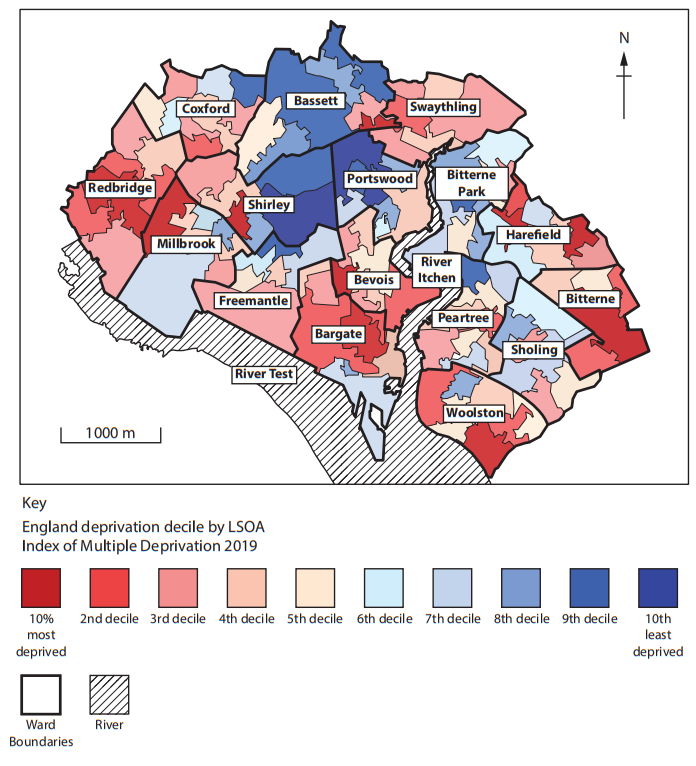
Explain how social progress resulting from regeneration can be measured through changes in deprivation and demographic characteristics.
Was this exam question helpful?
Study Figures 3a, 3b, 3c and 3d.

Figure 3a
Background information about Ireland
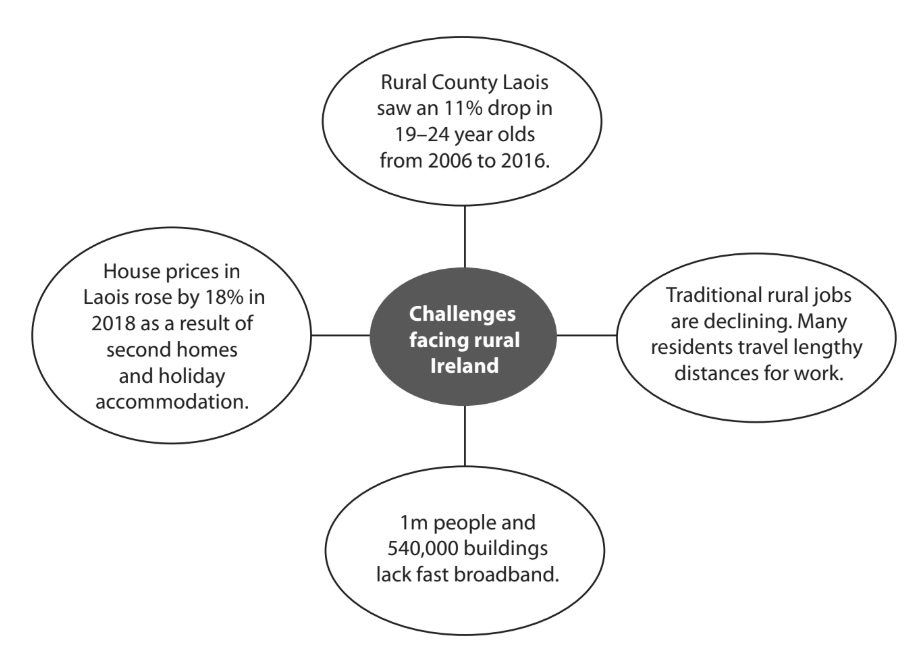
Figure 3b
Information about County Laois and rural Ireland
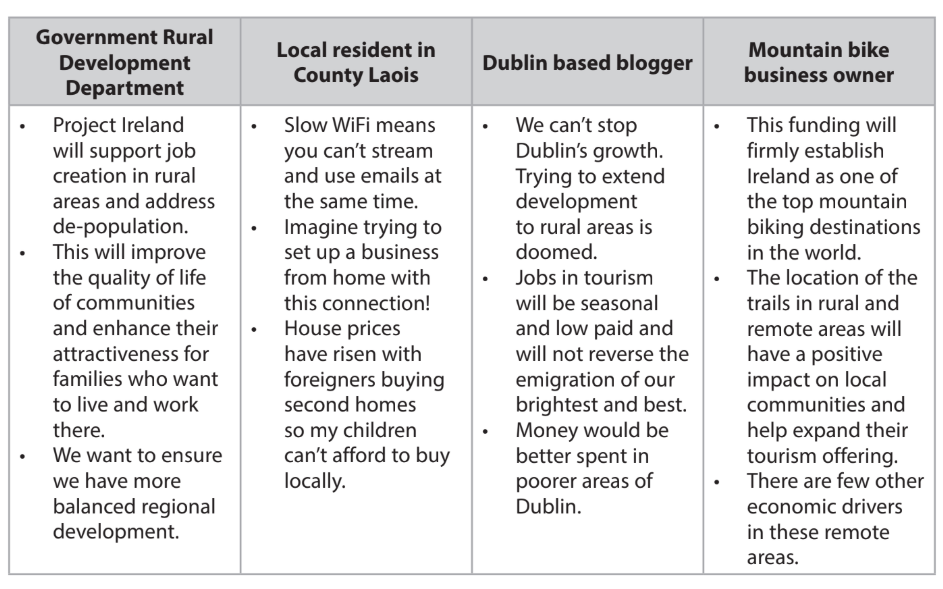
Figure 3c
Stakeholders’ views about rural issues in Ireland
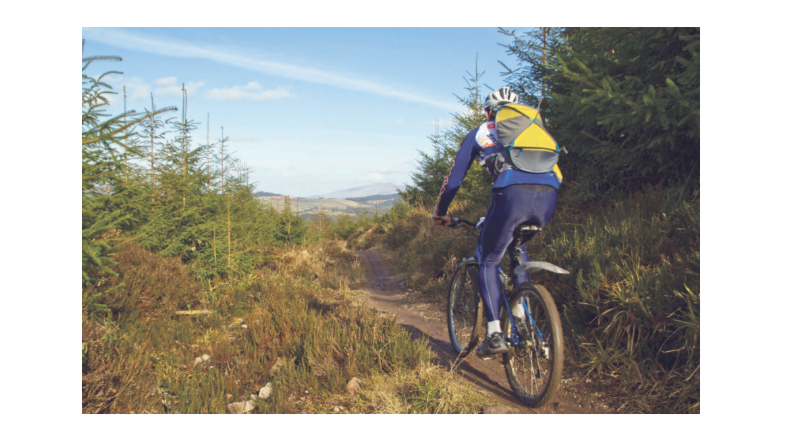
Figure 3d
Mountain biking in the Slieve Bloom mountains, County Laois
Evaluate the extent to which stakeholders may benefit from the Project Ireland strategies.
Was this exam question helpful?
Assess why stakeholders might use different criteria when judging the success of regeneration strategies in EITHER urban OR rural places.
Was this exam question helpful?
Explain different ways of measuring the success of regeneration strategies.
Was this exam question helpful?
Study Figures 4a, 4b, 4c, and 4d in the Resource Booklet.
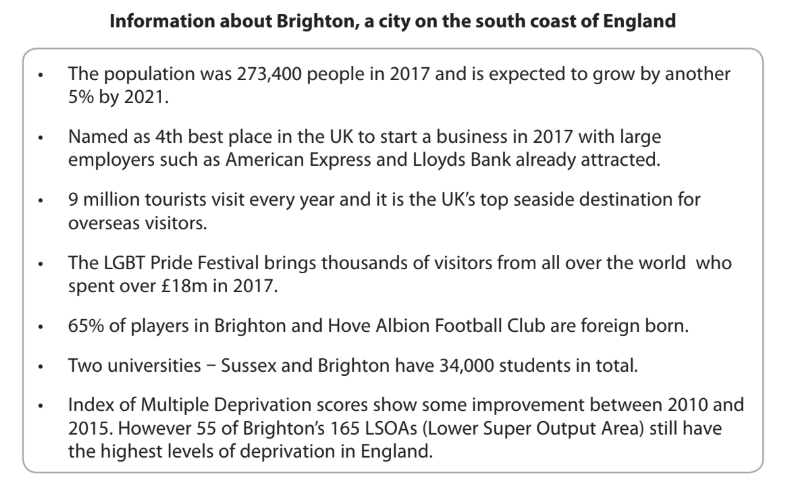
Figure 4a
Brighton fact file
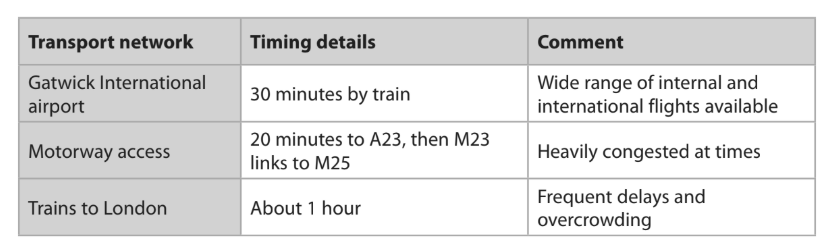
Figure 4b
Brighton’s UK and international transport links

Figure 4c
Prices for a two bedroom house in Brighton and UK
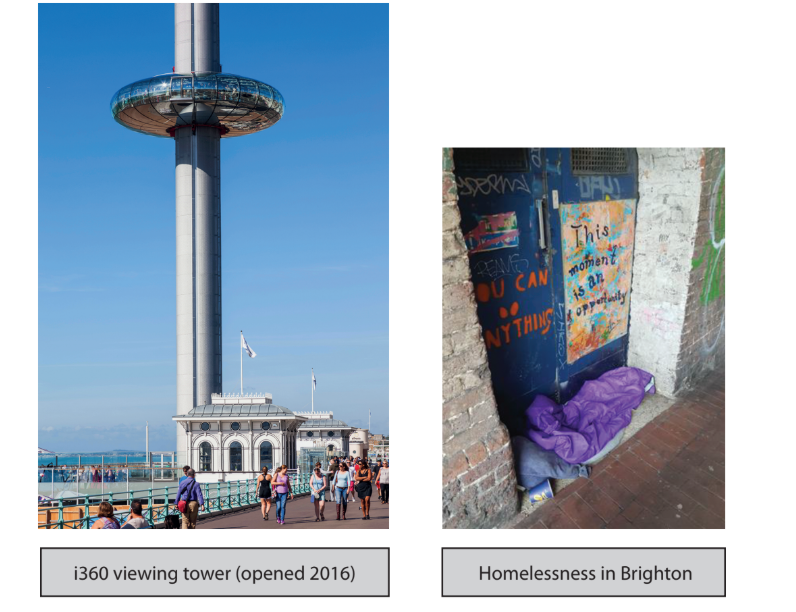
Figure 4d
Contrasting images of Brighton
Evaluate the extent to which Brighton could be described as a successful city.
Was this exam question helpful?