Using Market Research Data (AQA GCSE Business): Revision Note
Exam code: 8132

Interpreting market research data
Once market research has been gathered, it is often fed into a spreadsheet or database
This information is then used to generate a meaningful presentation of the data
A good presentation of the data in graph or chart form, makes it easier for the intended audience to understand it
Types of graphs and charts
1. Tables
Tables summarise data in an organised form

The table shows that:
Flashmaster generates the highest sales in each period
Sales of LumoLens are lower at the end of the year than at the start of the year
2. Bar charts
Bar charts show data that is independent of each other, such as sales per store or category sales

The bar chart shows that:
The top two categories have increased since 2016
The bottom three categories have all decreased, with DVD/Blueray in-store rentals falling the most
3. Pie charts
Pie charts show how a whole is divided into different elements, such as:
The total business sales divided among different product types it sells
The market share different competitors have

The pie chart shows that:
iPhones were the product which generated the highest value of sales revenue at 54%
Mac sales represent one fifth of the value of iPhone sales
Worked Example
Maggri Spice Ltd manufactures a range of hot curry pastes that are sold online and in specialist stores.
In 2022 total sales were $180,000, with sales for individual products shown in the pie chart below.
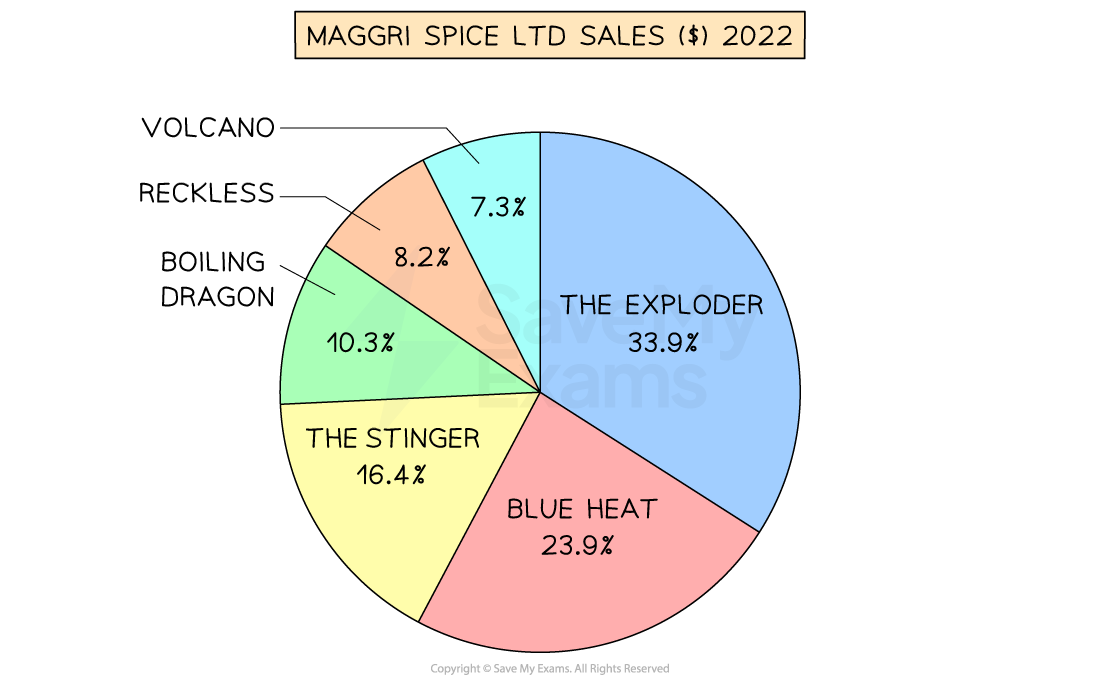
Calculate the value of sales of Blue Heat curry paste in 2022.
(2)
Step 1: Identify the percentage of total sales attributed to Blue Heat
In this case 23.9% of total sales can be attributed to Blue Heat
Step 2: Convert the percentage to a decimal
23.9% = 0.239
[1]
Step 3 - Multiply total sales by the decimal
$180,000 x 0.239 = $43,020
Blue Heat curry paste achieved sales of $43,020 in 2022
[1]
4. Infographics
Infographics are easy-to-understand visual representations of data

The infographic shows:
Mars has 140,000 associates
Mars is still a privately owned family company
Mars generated $45B in net sales
Examiner Tips and Tricks
In the exam, you may be asked to manipulate a table or chart. This could involve inserting missing data, completing unfinished charts, or correcting graphs containing errors. You may also be asked to carry out calculations using data contained in tables and graphs.
Market size and market share
Market size can be measured through sales volume or sales value
Sales volume is the number of products sold
E.g. The number of chocolate bars sold
Sales revenue = price x quantity sold
E.g. The total financial value of chocolate bars sold
The market share that a business enjoys is the proportion of the total sales of its product(s) compared to the market as a whole, e.g. Tesco has 26% of the UK grocery market
Market Share can be calculated using the formula
![]()
Examiner Tips and Tricks
You should always include your workings in calculation questions. This allows an examiner to apply the Own Figure Rule (OFR) if one part of your calculation is incorrect, meaning you are likely to gain some marks, even if the final answer is incorrect.
Worked Example
In 2022 the UK coffee shop/café market was worth £4.6bn. Sales of Starbucks Coffee were £328m in 2022.
Using the data, calculate, to 2 decimal places, the market share of Starbucks Coffee in the coffee shop/café market. You are advised to show your workings.
(3)
Step 1: Identify annual sales of Starbucks Coffee
£328m
Step 2: Identify total market sales in the coffee shop/cafe market
£4.6bn [1]
Step 3: Substitute figures into the formula
format('truetype')%3Bfont-weight%3Anormal%3Bfont-style%3Anormal%3B%7Dtext%7Bfill%3A%23000000%3B%3C%2Fstyle%3E%3C%2Fdefs%3E%3Cline%20stroke%3D%22%23000000%22%20stroke-linecap%3D%22square%22%20stroke-width%3D%221%22%20x1%3D%222.5%22%20x2%3D%22156.5%22%20y1%3D%2219.5%22%20y2%3D%2219.5%22%2F%3E%3Ctext%20font-family%3D%22Arial%22%20font-size%3D%2214%22%20text-anchor%3D%22middle%22%20x%3D%2236.5%22%20y%3D%2214%22%3ESales%3C%2Ftext%3E%3Ctext%20font-family%3D%22Arial%22%20font-size%3D%2214%22%20text-anchor%3D%22middle%22%20x%3D%2264.5%22%20y%3D%2214%22%3Eof%3C%2Ftext%3E%3Ctext%20font-family%3D%22Arial%22%20font-size%3D%2214%22%20text-anchor%3D%22middle%22%20x%3D%2278.5%22%20y%3D%2214%22%3Ea%3C%2Ftext%3E%3Ctext%20font-family%3D%22Arial%22%20font-size%3D%2214%22%20text-anchor%3D%22middle%22%20x%3D%22113.5%22%20y%3D%2214%22%3Ebusiness%3C%2Ftext%3E%3Ctext%20font-family%3D%22Arial%22%20font-size%3D%2214%22%20text-anchor%3D%22middle%22%20x%3D%2218.5%22%20y%3D%2235%22%3ETotal%3C%2Ftext%3E%3Ctext%20font-family%3D%22Arial%22%20font-size%3D%2214%22%20text-anchor%3D%22middle%22%20x%3D%2254.5%22%20y%3D%2235%22%3Esales%3C%2Ftext%3E%3Ctext%20font-family%3D%22Arial%22%20font-size%3D%2214%22%20text-anchor%3D%22middle%22%20x%3D%2280.5%22%20y%3D%2235%22%3Ein%3C%2Ftext%3E%3Ctext%20font-family%3D%22Arial%22%20font-size%3D%2214%22%20text-anchor%3D%22middle%22%20x%3D%2299.5%22%20y%3D%2235%22%3Ethe%3C%2Ftext%3E%3Ctext%20font-family%3D%22Arial%22%20font-size%3D%2214%22%20text-anchor%3D%22middle%22%20x%3D%22134.5%22%20y%3D%2235%22%3Emarket%3C%2Ftext%3E%3Ctext%20font-family%3D%22math183d412f76da6ec59341494f003%22%20font-size%3D%2214%22%20text-anchor%3D%22middle%22%20x%3D%22170.5%22%20y%3D%2224%22%3E%26%23xD7%3B%3C%2Ftext%3E%3Ctext%20font-family%3D%22Arial%22%20font-size%3D%2214%22%20text-anchor%3D%22middle%22%20x%3D%22192.5%22%20y%3D%2224%22%3E100%3C%2Ftext%3E%3Ctext%20font-family%3D%22math183d412f76da6ec59341494f003%22%20font-size%3D%2214%22%20text-anchor%3D%22middle%22%20x%3D%228.5%22%20y%3D%2282%22%3E%3D%3C%2Ftext%3E%3Cline%20stroke%3D%22%23000000%22%20stroke-linecap%3D%22square%22%20stroke-width%3D%221%22%20x1%3D%2218.5%22%20x2%3D%2271.5%22%20y1%3D%2277.5%22%20y2%3D%2277.5%22%2F%3E%3Ctext%20font-family%3D%22Arial%22%20font-size%3D%2214%22%20text-anchor%3D%22middle%22%20x%3D%2229.5%22%20y%3D%2272%22%3E%26%23xA3%3B%3C%2Ftext%3E%3Ctext%20font-family%3D%22Arial%22%20font-size%3D%2214%22%20text-anchor%3D%22middle%22%20x%3D%2246.5%22%20y%3D%2272%22%3E328%3C%2Ftext%3E%3Ctext%20font-family%3D%22Arial%22%20font-size%3D%2214%22%20text-anchor%3D%22middle%22%20x%3D%2265.5%22%20y%3D%2272%22%3Em%3C%2Ftext%3E%3Ctext%20font-family%3D%22Arial%22%20font-size%3D%2214%22%20text-anchor%3D%22middle%22%20x%3D%2227.5%22%20y%3D%2293%22%3E%26%23xA3%3B%3C%2Ftext%3E%3Ctext%20font-family%3D%22Arial%22%20font-size%3D%2214%22%20text-anchor%3D%22middle%22%20x%3D%2237.5%22%20y%3D%2293%22%3E4%3C%2Ftext%3E%3Ctext%20font-family%3D%22math183d412f76da6ec59341494f003%22%20font-size%3D%2214%22%20text-anchor%3D%22middle%22%20x%3D%2243.5%22%20y%3D%2293%22%3E.%3C%2Ftext%3E%3Ctext%20font-family%3D%22Arial%22%20font-size%3D%2214%22%20text-anchor%3D%22middle%22%20x%3D%2250.5%22%20y%3D%2293%22%3E6%3C%2Ftext%3E%3Ctext%20font-family%3D%22Arial%22%20font-size%3D%2214%22%20text-anchor%3D%22middle%22%20x%3D%2262.5%22%20y%3D%2293%22%3Ebn%3C%2Ftext%3E%3Ctext%20font-family%3D%22math183d412f76da6ec59341494f003%22%20font-size%3D%2214%22%20text-anchor%3D%22middle%22%20x%3D%2285.5%22%20y%3D%2282%22%3E%26%23xD7%3B%3C%2Ftext%3E%3Ctext%20font-family%3D%22Arial%22%20font-size%3D%2214%22%20text-anchor%3D%22middle%22%20x%3D%22107.5%22%20y%3D%2282%22%3E100%3C%2Ftext%3E%3C%2Fsvg%3E) [1]
[1]
Step 4: Present the answer to two decimal places
7.13% [1]

Unlock more, it's free!
Join the 100,000+ Students that ❤️ Save My Exams
the (exam) results speak for themselves:

Was this revision note helpful?
