Changing City Environments: Methods (Edexcel GCSE Geography A): Revision Note
Exam code: 1GA0

Urban Fieldwork Methods
The data collection methods depend on the aims/hypothesis of the fieldwork
In urban environment fieldwork the only equipment which may be used is a digital decibel meter
Other data collection may include questionnaires, traffic counts and environmental quality surveys
Data collection should include both quantitative and qualitative methods
Questionnaires
Questionnaires can be used to gather the opinions of local people on changes in the urban environment
An example of a statement question would be:
'The building of the new housing estate has increased traffic.' Do you strongly agree, agree, disagree or strongly disagree?
An example of a closed question would be:
'How long have you lived in this area?'
An example of an open question would be:
'What are your views on the new housing development in ............?'
These can be used to gather a large data sample
The data gathered in a questionnaire can be quantitative or qualitative
Environmental quality surveys
Environmental Quality Surveys (EQS) can be used to compare different sites with in the urban area
A survey would be completed for each site
Care needs to be taken to be as objective as possible
The data collected is quantitative
Feature | Negative | -2 | -1 | 0 | 1 | 2 | Positive |
|---|---|---|---|---|---|---|---|
Pavements | Pavements damaged and cracked in poor state of repair |
|
|
|
|
| Good quality pavements in excellent state of repair |
Buildings | Buildings look derelict and uncared for |
|
|
|
|
| Buildings look well cared for |
Litter | Lots of litter |
|
|
|
|
| No litter |
Traffic | Lots of traffic and congestion |
|
|
|
|
| No traffic |
Green space | No green space, trees or vegetation |
|
|
|
|
| Lots of green space, trees and other vegetation |
Graffiti | Lots of graffiti |
|
|
|
|
| No graffiti |
Traffic and pedestrian flow surveys
Traffic and pedestrian flow surveys can be used to compare the traffic and pedestrian levels at different sample sites
The data gathered in traffic and pedestrian surveys is quantitative
They can be completed on a tally chart at different sites and different times of the day
Vehicle | 9am | 11am | 1pm | 3pm |
|---|---|---|---|---|
Car |
|
|
|
|
Bus |
|
|
|
|
Lorry |
|
|
|
|
Motorbike |
|
|
|
|
Bicycle |
|
|
|
|
Photographs and Field Sketches
Photographs and field sketches are qualitative data
Just as with any data collection and presentation they have their strengths and weaknesses
In an urban environment enquiry, photographs and field sketches can be used to show changes in land use and their impact on the environment at sample site locations
Photographs are also useful for illustrating the data collection methods used
Worked Example
Identify which one of the following is a type of qualitative data
(1)
A | traffic count |
B | newspaper article |
C | pedestrian count |
D | population census |
Answer:
C: newspaper article
The alternative answers are incorrect because:
A, B and D all result in numerical data which means they are quantitative data
Examiner Tips and Tricks
Annotations and labels are not the same. A label is a simple descriptive point. For example, 'litter'. Whereas an annotation is a label with a more detailed description or explanatory point. For example, 'Large amounts of litter near to a playground where there are no bins available.
Dynamic urban areas enquiry data presentation
Data presentation can take many forms
Primary data
Much of the primary data collected in an urban environment enquiry will be presented in the form of graphs:
Each type of graph is suitable for particular data sets
The graphs may have strengths and limitation
Bar graphs
One of the simplest methods to display discrete data
Bar graphs are useful for:
Comparing classes or groups of data
Changes over time
Strengths | Limitations |
|---|---|
Summarises a large set of data | Requires additional information |
Easy to interpret and construct | Does not show causes, effects or patterns |
Shows trends clearly | Can only be used with discrete data |

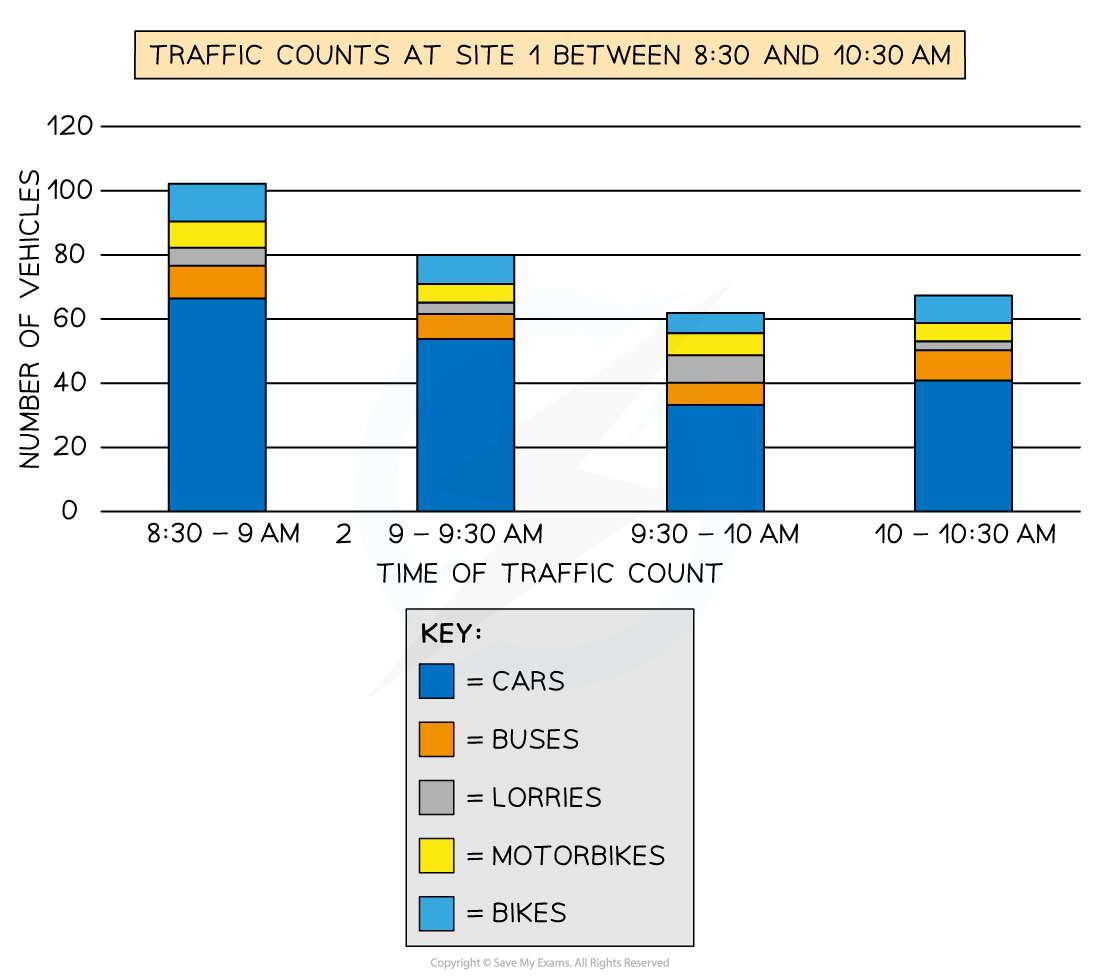
Compound or divided bar chart
The bars are subdivided to show the information, with all bars totalling 100%
The main use of a divided bar chart is to compare numeric values between levels of a variable such as time
Strengths | Limitations |
|---|---|
Easier to compare the changes in sections | Difficult to identify changes |
Summarises a large set of data | Difficult to work out the measurement of each section |
| Accurate construction of the graph is difficult |
Rose diagrams
Use multidirectional axes to plot data with bars
Compass points are used for the axis direction
Can be used for data such as wind direction, noise or light levels
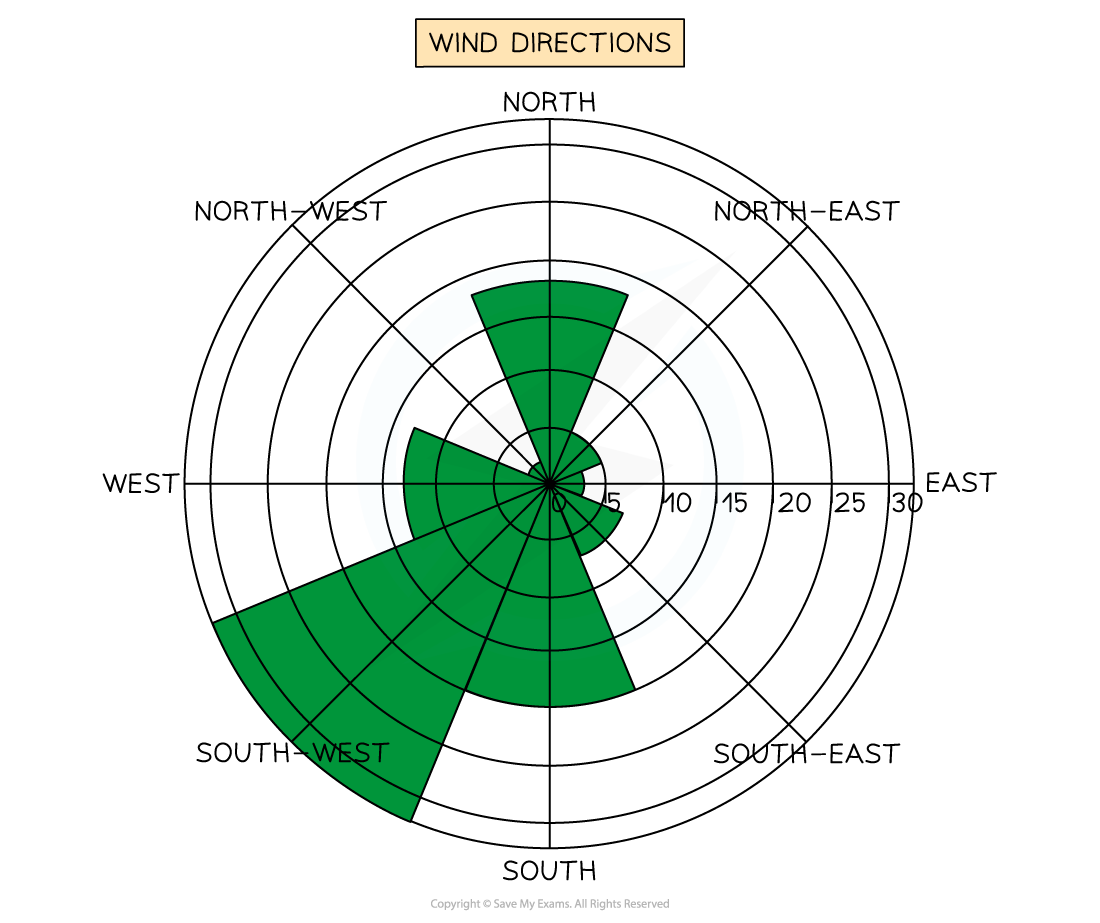
Wind Direction Shown on a Rose Diagram
Scatter graph
Points should not be connected
The best fit line can be added to show the relations
Used to show the relationship between two variables
In a river study, they are used to show the relationship between different river characteristics such as the relationship between the width and depth of the river channel
Strengths | Limitations |
|---|---|
Clearly shows data correlation | Data points cannot be labeled |
Shows the spread of data | Too many data points can make it difficult to read |
Makes it easy to identify anomalies and outliers | Can only show the relationship between two sets of data |

Proportional symbols map
The symbols on the map are drawn in proportion to the variable represented
Usually, a circle or square is used but it could be an image
Can be used to show a range of data, for example, population, wind farms and electricity they generate, traffic or pedestrian flows
Strengths | Limitations |
|---|---|
Illustrates the differences between many places | Not easy to calculate the actual value |
Easy to read | Time-consuming to construct |
Data is specific to particular locations | Positioning on a map may be difficult, particularly with larger symbols |
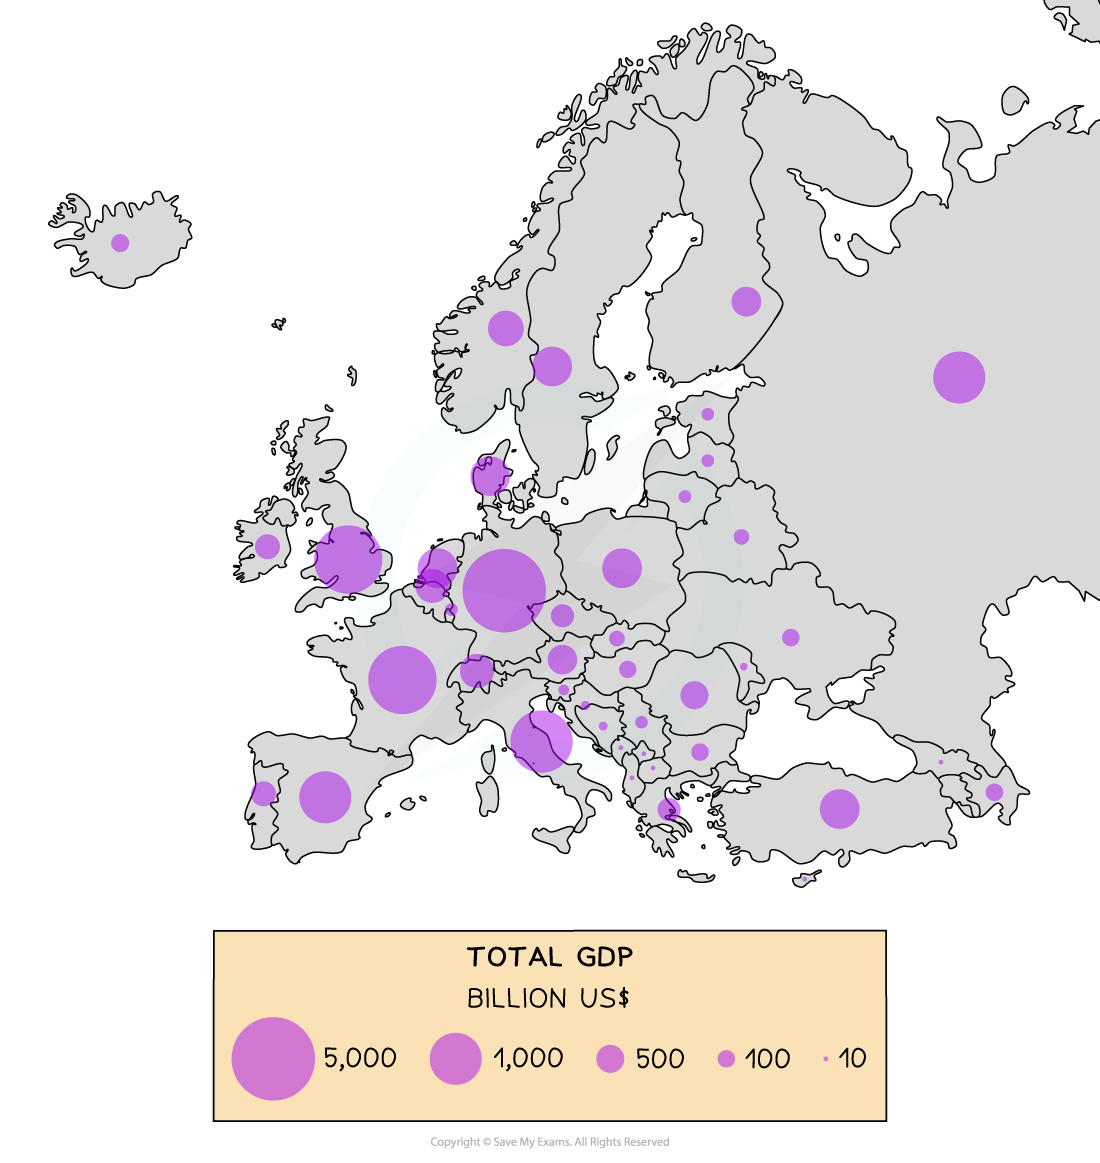
Proportional Circles Map Showing GDP (Billion US$) across Europe
Worked Example
A group of students collected data to investigate change in Chester's central/inner urban area
The students produced divided bar charts to show changes in land use
State one limitation of using divided bar charts to present this data
(1)
Answer:
Any of the following answers would be awarded one mark
Difficult to identify changes (1)
Difficult to work out actual percentages (1)
Difficult to compare differences between data sets (1)
Just shows percentage, rather than raw data (1)
Difficult to construct accurately (1)
Examiner Tips and Tricks
In the exam, you will not be asked to draw an entire graph. However, it is common to be asked to complete an unfinished graph using the data provided. You may be asked to identify the highest or lowest score or an anomalous result. When completing a graph:
Take your time to ensure that you have marked the data on to the graph accurately
Use the same style as the data which has already been put on the graph:
Bars on the graph should be the same width
If the dots on the graph are connected by a line then you should do the same
Secondary data
Any fieldwork should include secondary data as well as primary data
In an urban environment enquiry, suitable data may include:
Historical traffic counts
Maps of the area where land use has changed
Newspaper articles/websites about land use change
Aerial photographs
Analysis
Once all the data has been collected and presented, it needs to be analysed
The data which is collected regarding rural environment change such as environmental quality surveys and traffic counts is quantitative data and will be analysed using statistical methods
One of the main statistical methods that may be used is the mean
Analysing photographs and field sketches
The use of photographs and field sketches is a qualitative analysis
Photographs and field sketches can be used in an urban environment enquiry to analyse a number of different features:
Features of different land use at the sample sites
Data collection techniques
Images of land use changes: new housing/road/industry
Conclusion
Once the data has been analysed, conclusions can be reached
The conclusion should state whether the hypothesis has been proved or disproved
Identify and explain any anomalies such as:
A sample site that has a low traffic count but high levels of noise pollution
Anomalies may occur due to a natural cause or maybe the result of incorrect recording or human error when using the equipment
Evaluation
The final stage of the rural environment enquiry is the evaluation which outlines how successful or not the rural environment enquiry was and what could be done differently were it to be repeated. For example:
Next time I would take measurements over a longer period of time to ensure the reliability of the data
I completed the environmental survey on my own which is subjective, next time I would complete it in groups and take the mode score
I think my investigation went well and I would like to repeat it at another time of year to see if this impacts the environmental quality
Examiner Tips and Tricks
The 8-mark fieldwork question is often an evaluation of your enquiry or of unfamiliar fieldwork. The evaluation could be regarding data collection, analysis or your conclusion. The key factors to remember to include in your answer are:
What went well - how do you know that your results were accurate and therefore valid?
Is the enquiry reliable - Could it be repeated and the same results achieved?
What could have been improved?
What would you do if you were to repeat the enquiry?

Unlock more, it's free!
Join the 100,000+ Students that ❤️ Save My Exams
the (exam) results speak for themselves:

Was this revision note helpful?
