1a
1 mark
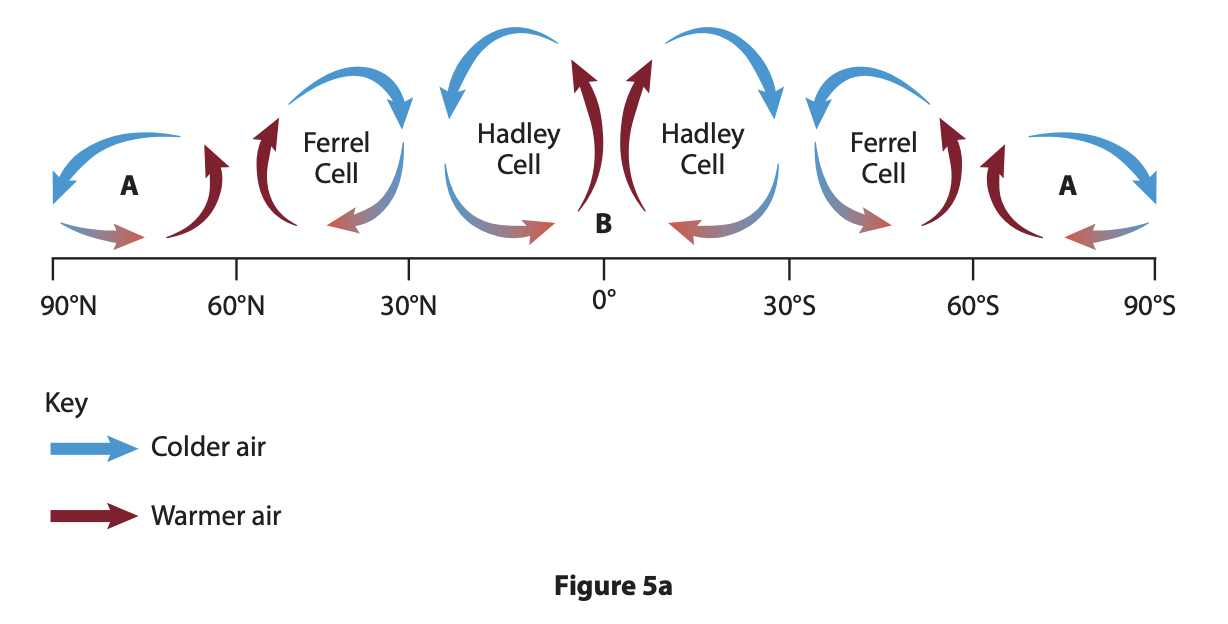
The atmosphere operates as a global system transferring heat and energy.
Study Figure 5a in the Resource Booklet.
Name the circulation cells labelled A.
1b
2 marks
Explain why air is rising in the area labelled B
Was this exam question helpful?