1
1 mark
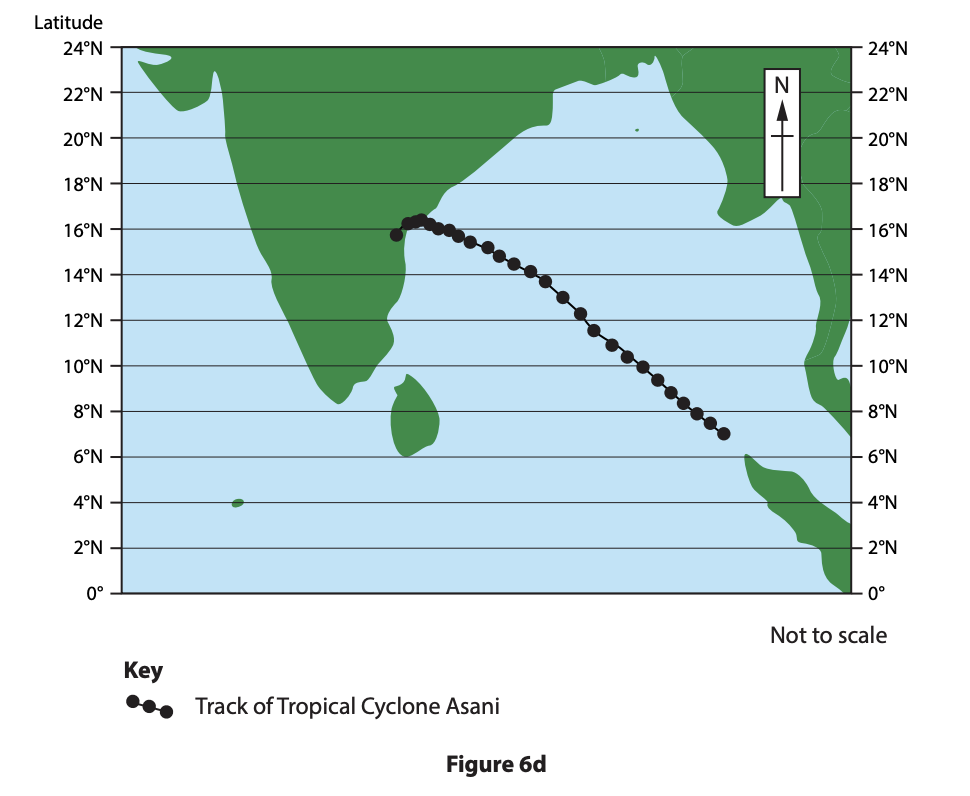
Tropical cyclones are extreme weather events.
Study Figure 6d in the Resource Booklet.
Identify the latitudes within which Tropical Cyclone Asani travelled.
0–4°N
4–6°N
7–17°N
18–24°N
Was this exam question helpful?
Exam code: 1GA0
Tropical cyclones are extreme weather events.
Study Figure 6d in the Resource Booklet.
Identify the latitudes within which Tropical Cyclone Asani travelled.
0–4°N
4–6°N
7–17°N
18–24°N
Was this exam question helpful?
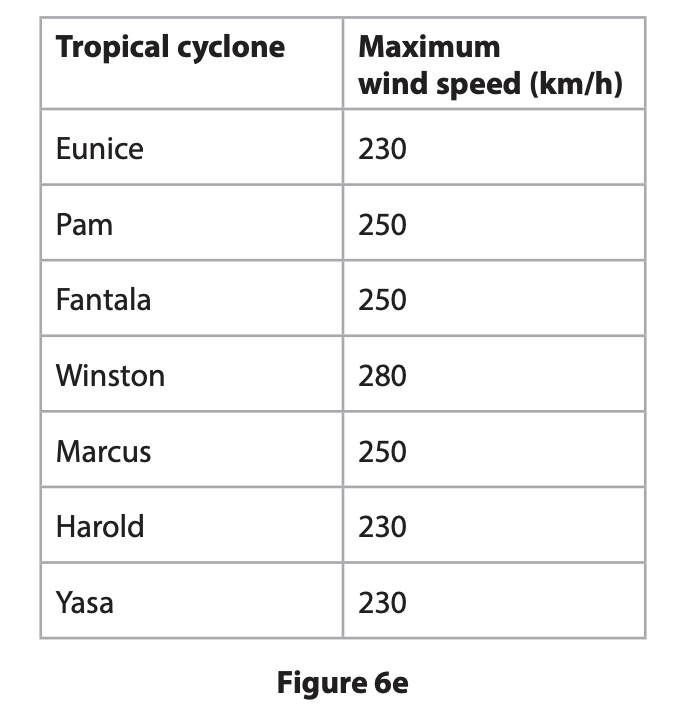
Study Figure 6e in the Resource Booklet.
Calculate the mean of the maximum wind speeds shown in Figure 6e.
Answer to one decimal place.
You must show your working in the space below
............................... km/h
Was this exam question helpful?
In this question, four of the marks awarded will be for your spelling, punctuation, grammar and for your use of specialist terminology.
Assess the importance of the different impacts of tropical cyclones in a named emerging or developing country.
Named emerging or developing country
Was this exam question helpful?
Tropical cyclones are extreme weather events.
Tropical cyclone | Month | Deaths |
|---|---|---|
Idai | March | 1303 |
Kenneth | April | 50 |
Lekima | August | 91 |
Dorian | September | 63 |
Nakri | November | 22 |
Bulbul | November | 38 |
Phanfone | December | 50 |
Figure 6b
Tropical cyclones with the highest number of deaths in 2019
Study Figure 6b in the Resource Booklet.
Calculate the mean number of deaths per tropical cyclone shown on Figure 6b.
You must show your working in the space below.
Was this exam question helpful?
Explain one reason why some tropical cyclones lead to more deaths than others.
Was this exam question helpful?
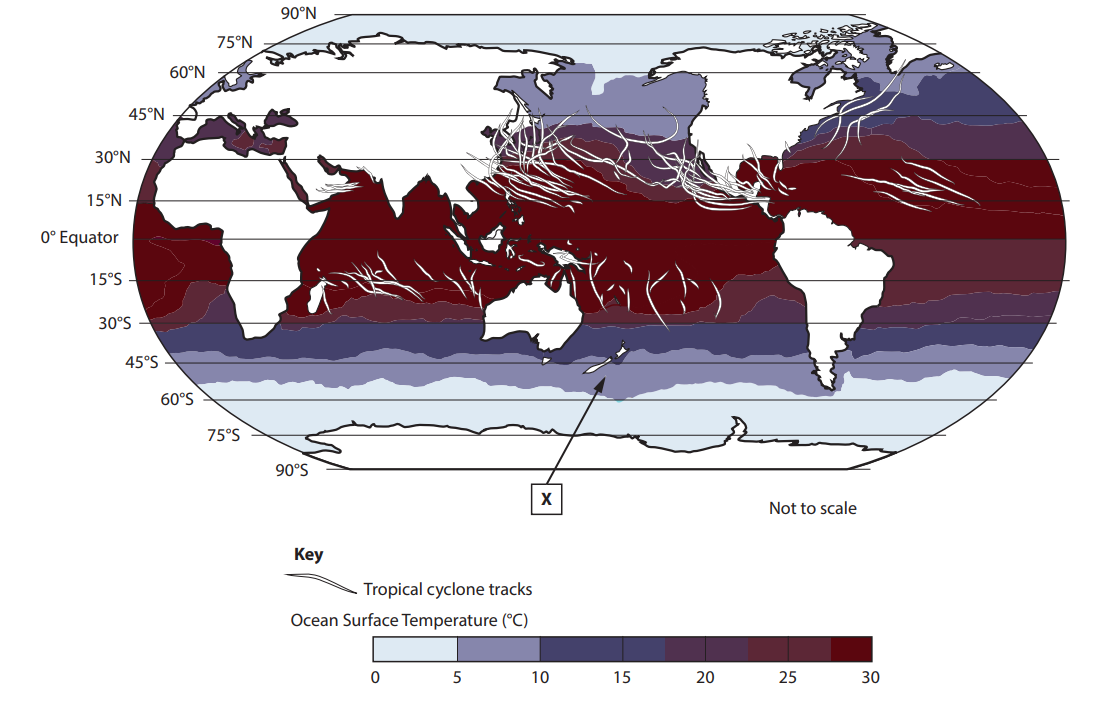
Figure 6c
Global ocean surface temperatures and tropical cyclone tracks
Study Figure 6c in the Resource Booklet.
Identify the ocean surface temperature range at X.
0–5°C
5–10°C
20–25°C
25–30°C
Suggest one reason for the link between ocean surface temperature and the location of tropical cyclones.
You must use evidence from Figure 6c in your answer.
Was this exam question helpful?
Evaluate the following statement.
‘Responses to tropical cyclones are more successful in developed countries than in emerging or developing countries.’ |
Was this exam question helpful?
Tropical cyclones (hurricanes and typhoons) develop under specific conditions and in certain locations.
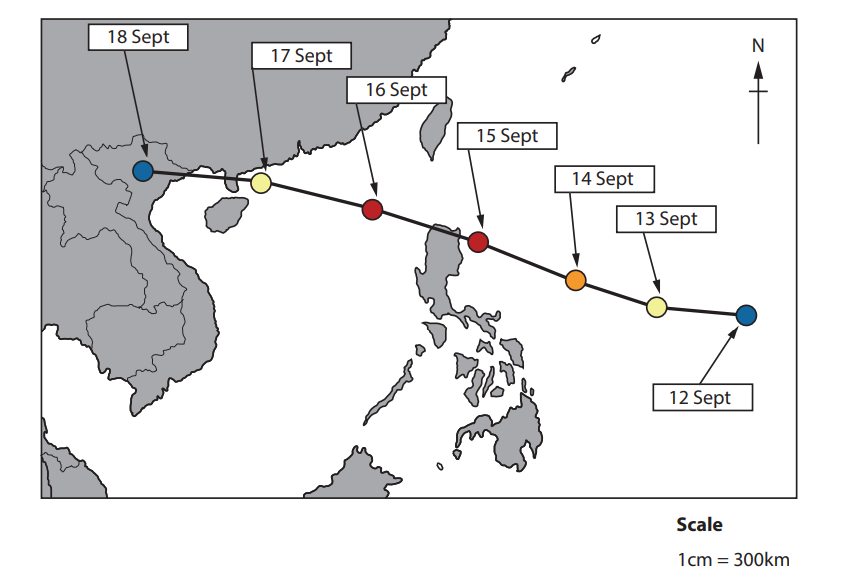
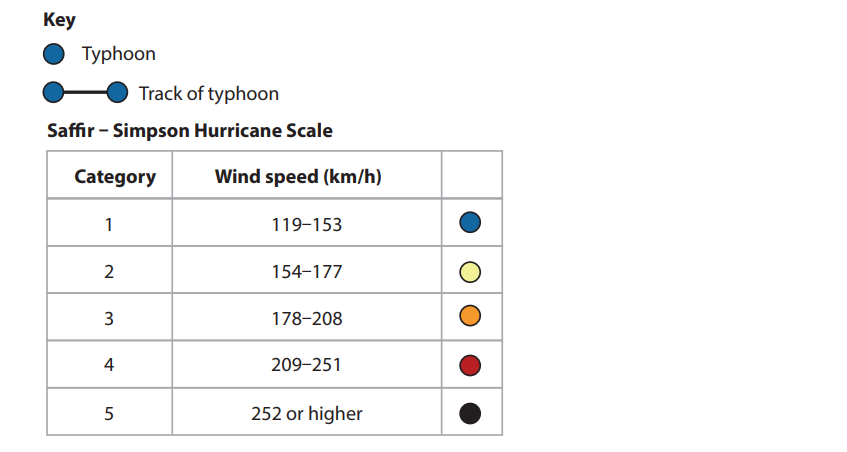
Study Figure 6b in the Resource Booklet.
Identify which one of the following dates had the strongest wind speeds.
12 Sept
14 Sept
16 Sept
18 Sept
Calculate the total distance travelled by Typhoon Ompong between 12–18 September 2018.
Answer to one decimal place.
You must show your working in the space below.
Was this exam question helpful?
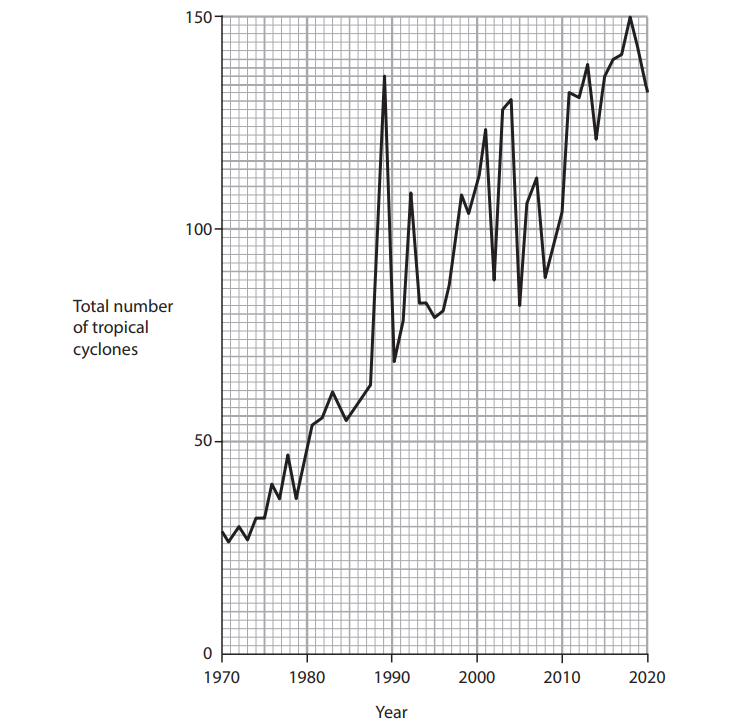
Figure 6c
Total number of tropical cyclones worldwide, 1970–2020
Study Figure 6c in the Resource Booklet.
Identify the year with the highest number of tropical cyclones.
Suggest one reason for the overall change in the frequency of tropical cyclones between 1970 and 2020.
You must use evidence from Figure 6c in your answer.
Was this exam question helpful?