1
1 mark
Identify one economic activity that is in the primary sector
banking
fishing
teaching
shipbuilding
Was this exam question helpful?
Exam code: 1GA0
Identify one economic activity that is in the primary sector
banking
fishing
teaching
shipbuilding
Was this exam question helpful?
The level of development can be measured in different ways, and it changes over time.
Study Figure 2a below
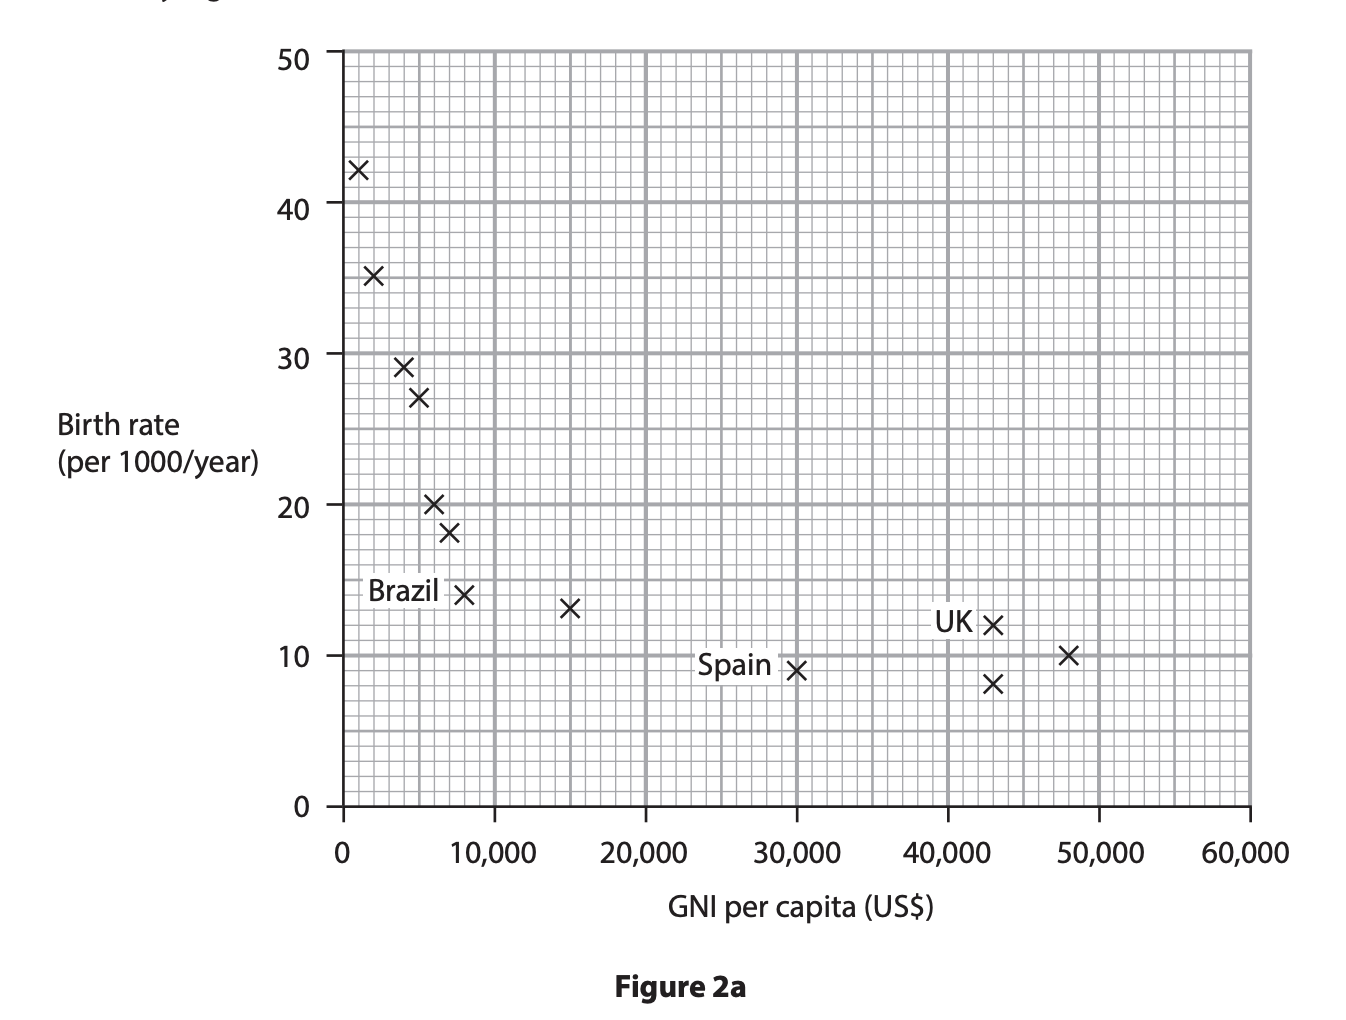
Complete Figure 2a by plotting the data in the table below.
Country | Birth rate (per 1000/year) | GNI per capita (US$) |
|---|---|---|
Sweden | 12 | 58,000 |
State the GNI per capita of Spain shown on Figure 2a.
.............................................................. US$ per capita
Compare the GNI per capita for the UK and Brazil shown in Figure 2a.
Use data in your answer
Calculate the mean birth rate for the countries with a GNI per capita between 40,000 and 50,000 US$.
Write your answer to the nearest whole number.
You must show your working in the space below.
Was this exam question helpful?
Explain one way a lack of food security can limit a country’s rate of development.
Was this exam question helpful?
Explain two historical factors that have led to global variations in the level of development
Was this exam question helpful?
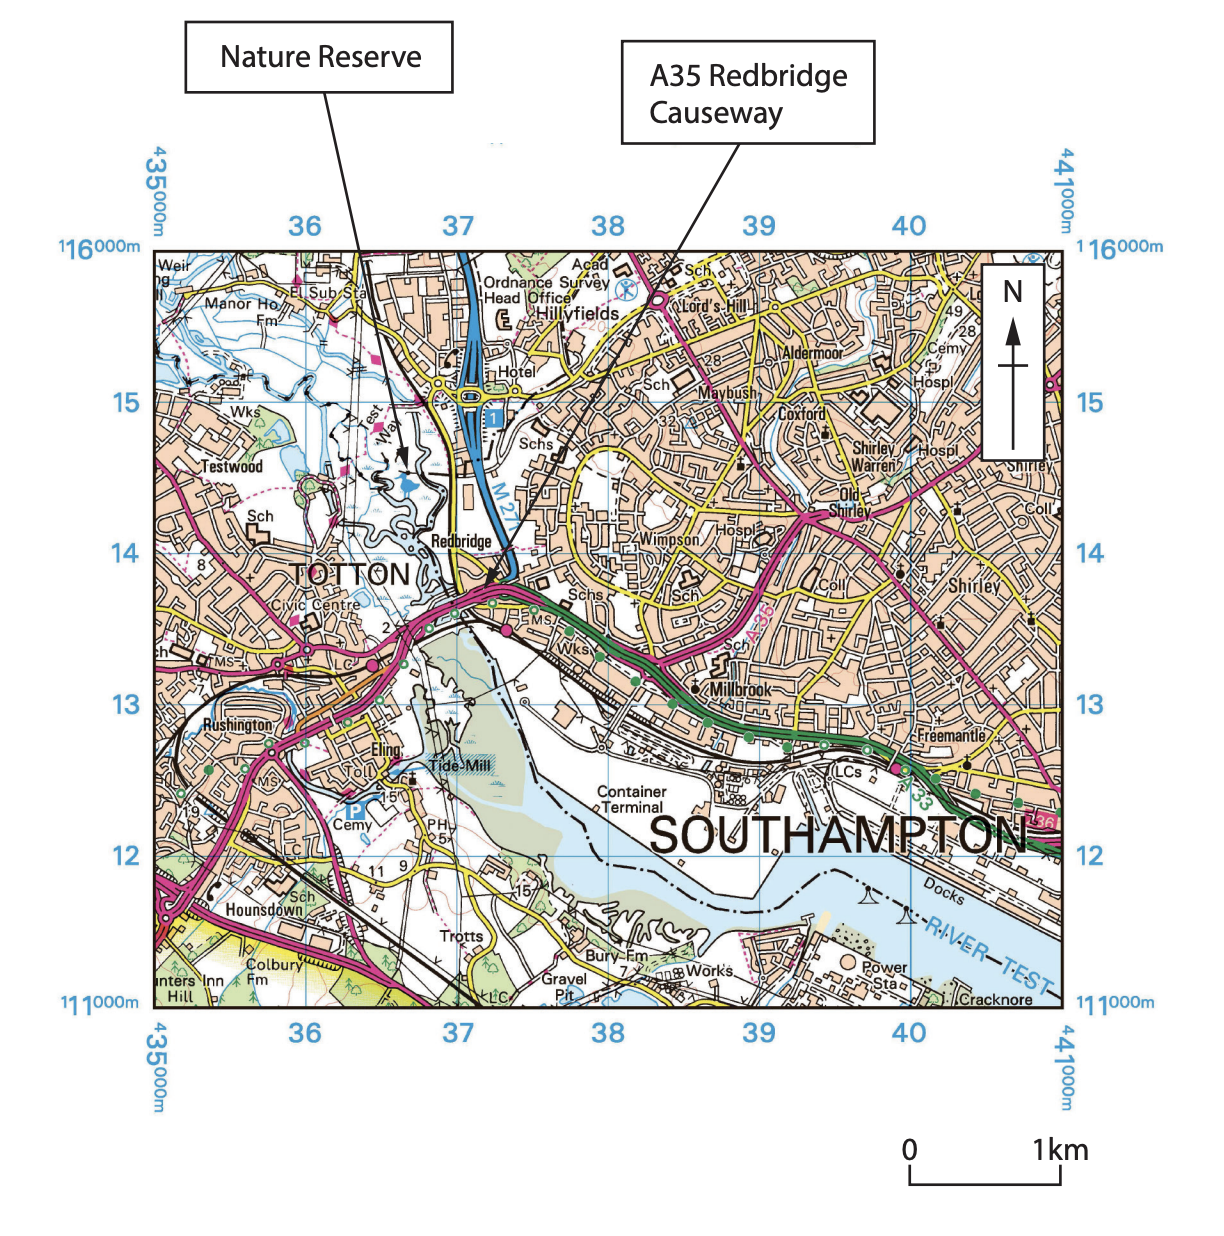
Figure 2b

The A35 Redbridge Causeway project is an example of a top-down development project in the UK.
Study Figures 2b and 2c in the Resource Booklet.
Identify the grid square where the nature reserve is located on Figure 2b
Identify the six-figure grid reference for the civic centre in Totton.
375148
352131
385111
361135
Identify the straight-line distance from the school (Sch) at 356141 to the school (Sch) at 385152.
1.5 km
3 km
4.5 km
6 km
Suggest one disadvantage of the A35 Redbridge Causeway project.
Use evidence from Figure 2c in your answer.
Suggest two advantages of the A35 Redbridge Causeway project.
Use evidence from Figure 2c in your answer.
Advantage 1
Was this exam question helpful?
International trade has influenced the development of many developing and emerging countries, such as Guyana.
Explain two physical factors that have led to some countries having a high level of development.
Was this exam question helpful?
Study Figure 2c
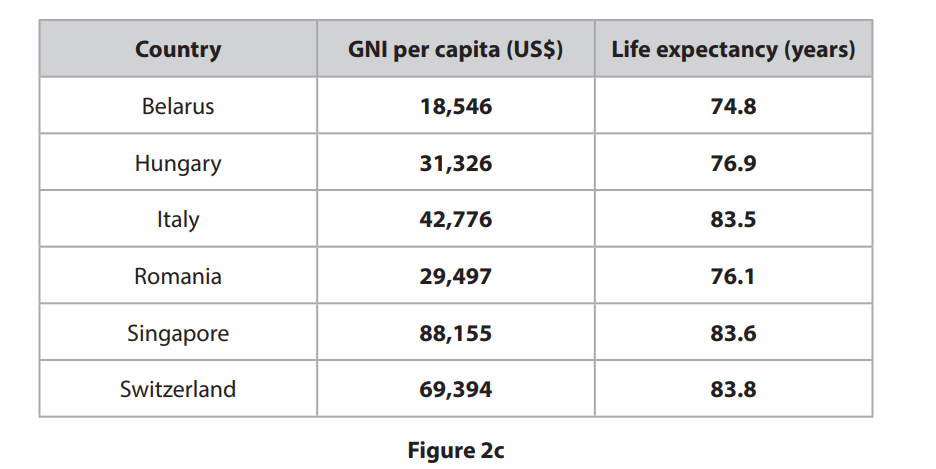
Calculate the mean life expectancy for the countries shown on Figure 2c.
Write your answer to one decimal place.
Describe the relationship between GNI per capita and life expectancy shown in Figure 2c.
Figure 2c includes two measures used to calculate the Human Development Index (HDI) for a country.
State one other measure used in the calculation of the HDI.
Was this exam question helpful?
Assess the importance of historical and economic factors in the development of countries
Was this exam question helpful?
The level of development of a country can be measured in different ways, for example by using the Human Development Index (HDI).
(a) Study Figure 2a below
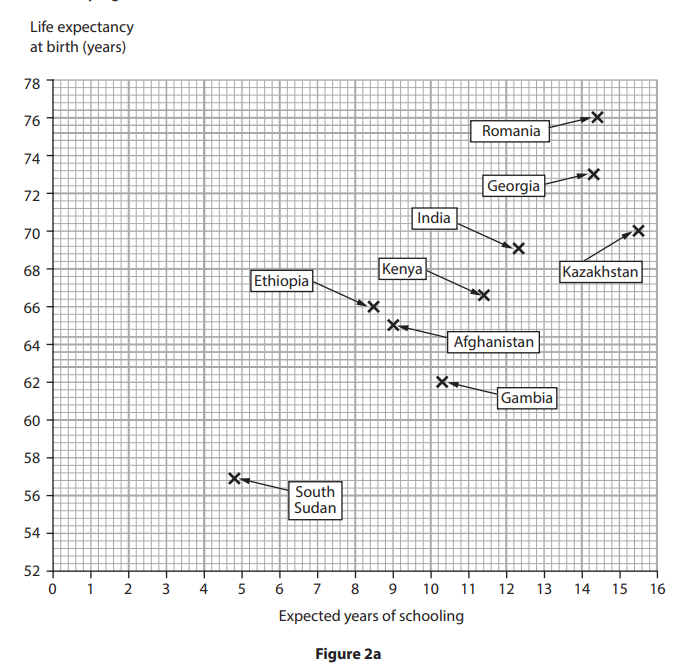
Complete Figure 2a by plotting the data in the table below.
Country | Life expectancy at birth (years) | Expected years of schooling |
|---|---|---|
Sierra Leone | 53 | 9.8 |
Brazil | 76 | 15.0 |
Draw a best fit line on Figure 2a.
Describe the relationship shown in Figure 2a.
Use data in your answer.
Suggest two reasons for the differences in life expectancy shown in Figure 2a. Use data in your answer.
Figure 2a shows two measures used in the calculation of the HDI.
Identify one other measure used to calculate the HDI.
Infant mortality rate
Number of doctors per 1,000 people
Literacy rate
Gross National Income per capita
Was this exam question helpful?
Explain one historical factor that has led to variations in levels of development within the UK.
Was this exam question helpful?