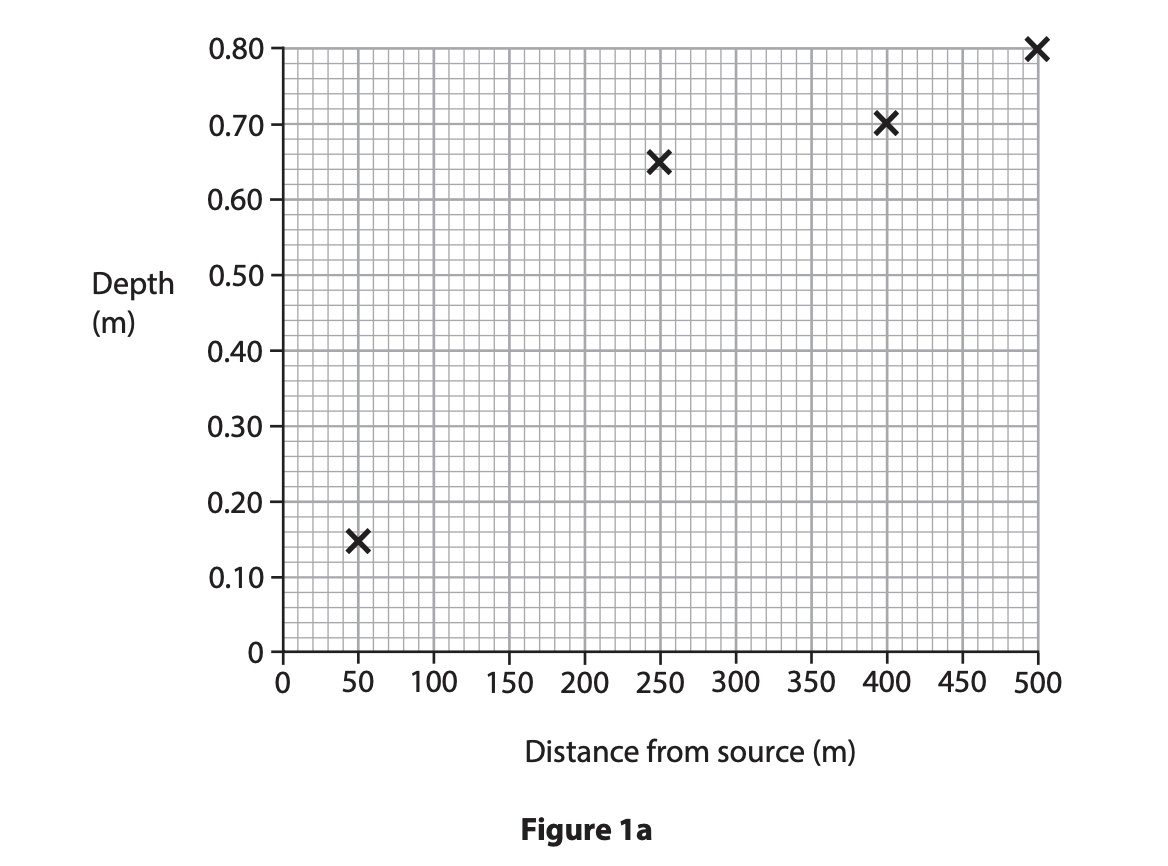
River Landscapes: River Channel Change (Edexcel GCSE Geography A): Exam Questions

Exam code: 1GA0

37 mins10 questions
1a2 marks

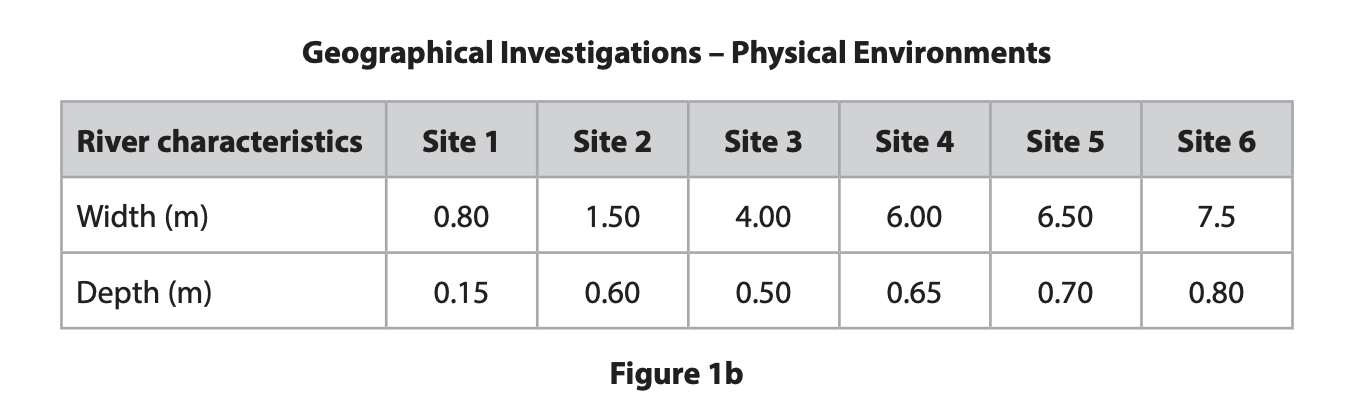
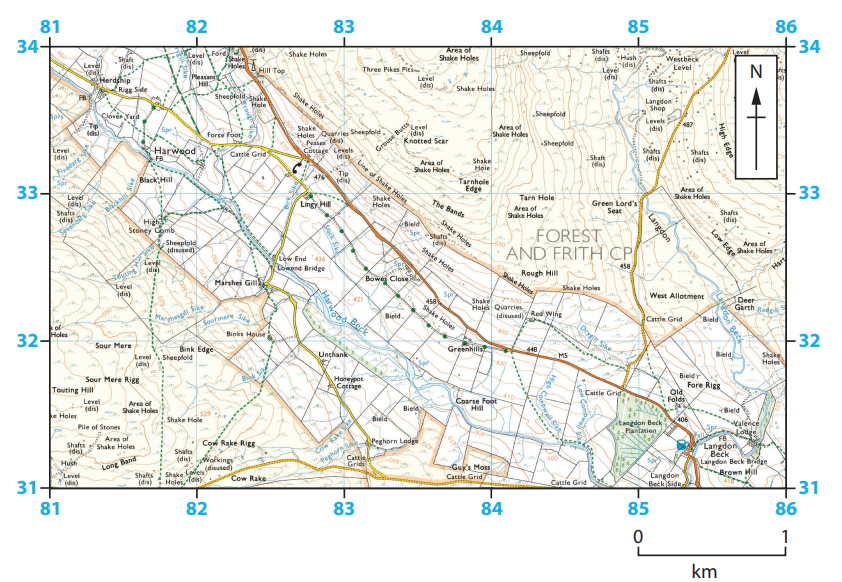
A group of students collected data to investigate changes at six sites along a river channel.

Describe one fieldwork method that could have been used by the students to measure river depth.

1b2 marks

Explain one disadvantage of using this fieldwork method.

22 marks

The students measured the river depth at each site and presented this data on a scatter graph.

Study Figure 1a below.

Scatter plot showing depth (m) against distance from source (m) with four data points at approximately (50, 0.15), (200, 0.65), (400, 0.55), (500, 0.8).
A scatter graph to show the relationship between river depth and distance from source

Complete Figure 1a by plotting the data below

Distance from source (m)

Depth (m)

100

0.60

200

0.50

3a2 marks
Table showing river characteristics across six sites: widths range from 0.80m to 7.5m and depths from 0.15m to 0.80m.
Data collected by the group of students moving downstream

Study Figure 1b in the Resource Booklet.

Calculate the mean width of the river.

Give your answer to one decimal place.

You must show your working in the space below.

Mean width .............................................................. m

3b2 marks

Identify the two correct statements about the river data in Figure 1b.

  • the river depth decreases between site 1 and site 6

  • the river width increases overall between site 1 and site 6

  • the river width decreases between site 3 and site 4

  • the river depth decreases between site 2 and site 3

  • the river is twice as deep at site 2 than it is at site 1

41 mark

You have studied a river as part of your geographical investigation.

Evaluate the following statement about your fieldwork.

question 4

Title of your geographical investigation 

52 marks

You have studied a river landscape as part of your geographical investigation.

Name of your fieldwork location

Explain one advantage of a sampling strategy you used in your geographical investigation.

Named sampling strategy

62 marks

Explain one risk you considered before carrying out the data collection at your chosen location.

Named risk

74 marks

Explain two ways you tried to make sure that your data collection methods were accurate.

88 marks
Scatter plot with a line of best fit showing river width (cm) increasing with distance from source (m), ranging from 0 to 1200 metres.

Figure 1a

River width data collected by the students

Bar chart showing river depth in centimetres increasing as the distance from the source in metres increases from 100 to 1000 metres.

Figure 1b

River depth data collected by the students

Study Figures 1a and 1b in the Resource Booklet.

A group of students investigating a river expected both width and depth to increase downstream.

After analysing Figures 1a and 1b, the students concluded that changes in width were more in line with their expectations.

Assess the extent to which you agree with this conclusion.

92 marks
Topographic map showing Harwood, Lingy Hill, and Forest and Frith CP area with contour lines, pathways, and roads. Includes a scale and a north arrow.
Map key showing symbols: secondary road, narrow road, coniferous and non-coniferous wood, coppice, and contours at 10 metres vertical interval.

Figure 1

1:25,000 OS map of a river landscape in County Durham

Study Figure 1 in the Resource Booklet.

Describe one fieldwork method the students could have used to collect data to investigate this river landscape.

Chosen fieldwork method.

108 marks
Topographic map showing Harwood, Lingy Hill, and Forest and Frith CP area with contour lines, pathways, and roads. Includes a scale and a north arrow.
Map key showing symbols: secondary road, narrow road, coniferous and non-coniferous wood, coppice, and contours at 10 metres vertical interval.

Figure 1

1:25,000 OS map of a river landscape in County Durham

Study Figure 1 in the Resource Booklet.

A group of students used this 1:25,000 OS map extract to suggest the following two possible enquiry questions to investigate this river landscape.

Harwood Beck is a river that flows in a south easterly direction from 81 33 to 85 31.

1. Does the discharge of Harwood Beck increase downstream?

2. Does the risk of flooding to rural settlements increase downstream?

Evaluate which one of these enquiry questions would be the most suitable.