1
4 marks
You have studied an urban area as part of your own fieldwork.
Explain two methods you used to collect your fieldwork data.
Was this exam question helpful?
Exam code: 1GA0
You have studied an urban area as part of your own fieldwork.
Explain two methods you used to collect your fieldwork data.
Was this exam question helpful?
Explain one advantage of a technique used to present your fieldwork data.
Technique used
Was this exam question helpful?
Explain one disadvantage of a sampling strategy used in your investigation.
Named sampling strategy
Was this exam question helpful?
Explain one way secondary data helped to support your investigation.
Was this exam question helpful?
Study Figure 3 in the Resource Booklet.
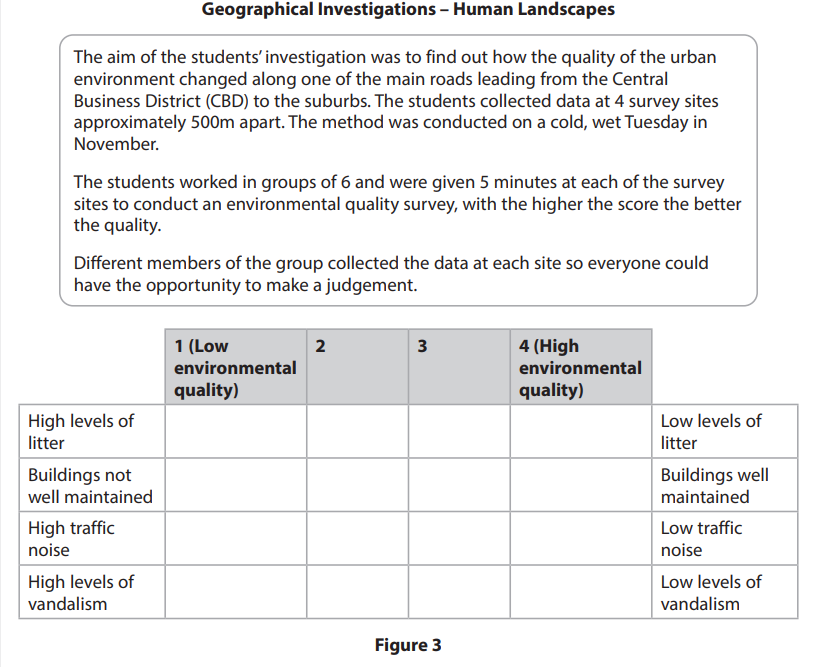
A group of students were investigating the quality of the environment in an urban area.
Evaluate the following statement.
The students’ method shown in Figure 3 to collect data was accurate and reliable. |
Was this exam question helpful?
A group of students collected data to investigate change in a central/inner urban area.
Study Figure 3a in the Resource Booklet.
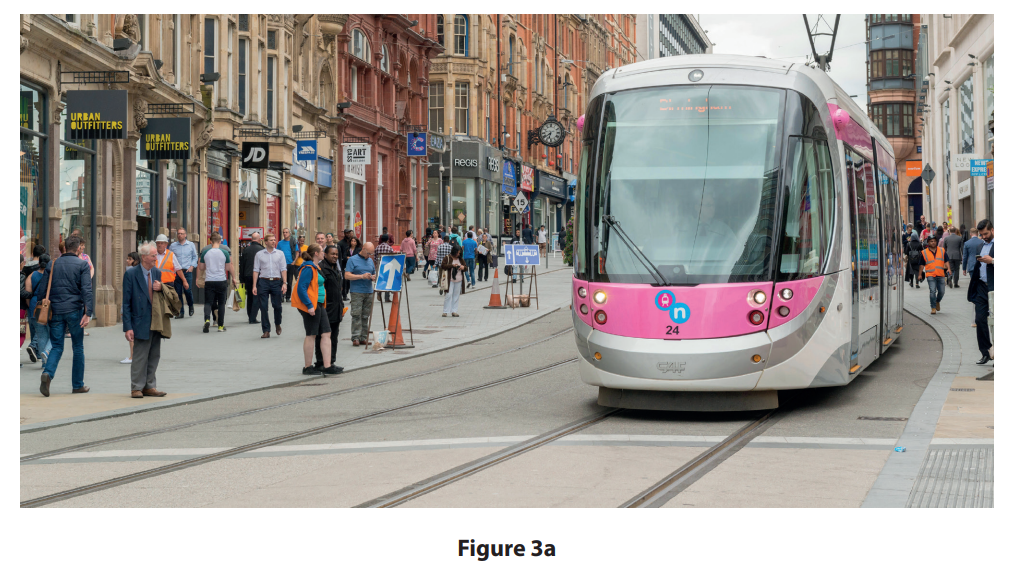
Identify the two most likely land uses in Figure 3a.
commercial (shops)
industrial
transport
open space
residential (housing)
Describe one way the students could have presented their land use data.
Was this exam question helpful?
Study Figure 3b in the Resource Booklet.
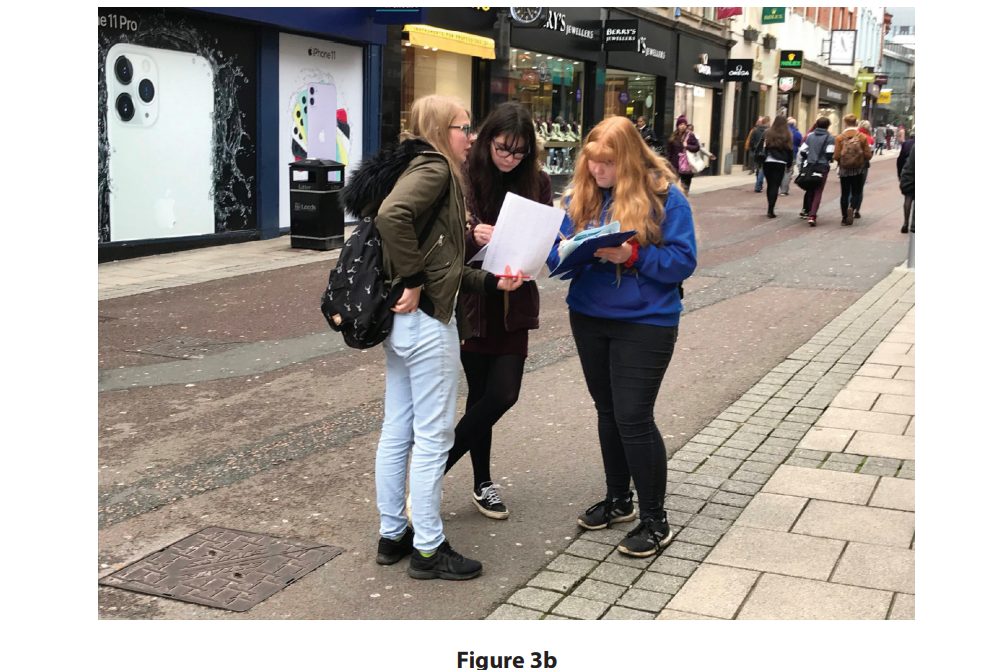
Explain one limitation of using this fieldwork method.
Was this exam question helpful?
The students used random sampling to select the sites for an environmental quality survey (EQS).
Explain one limitation of using random sampling to collect this data.
Was this exam question helpful?
Study Figure 3c below. It shows a bar chart created by the students to show the mean results of their EQS.
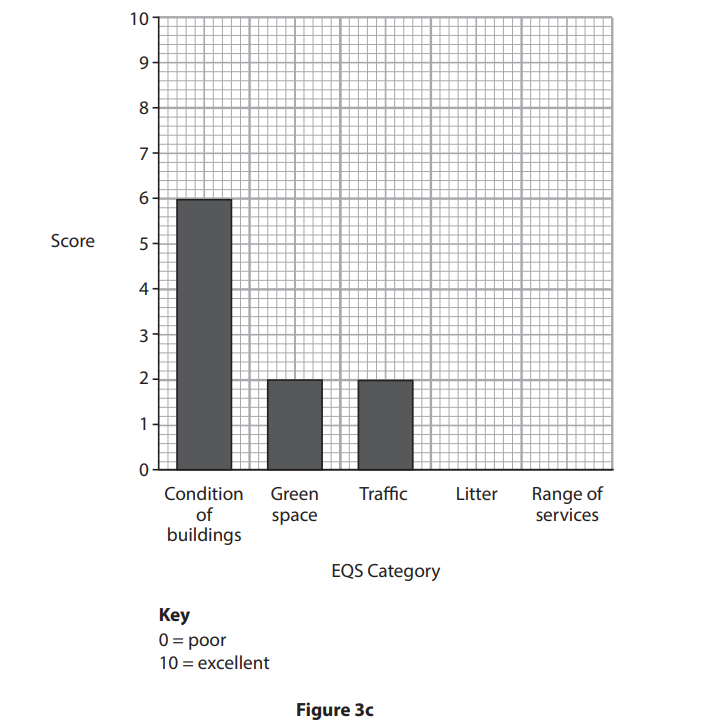
Plot the data in the table below by completing Figure 3c.
EQS Category | Score |
|---|---|
Litter | 6 |
Range of services | 3 |
Was this exam question helpful?
You have studied a central/inner urban area(s) as part of your geographical investigation.
Evaluate the success of the methods used to collect your fieldwork (primary) and secondary sources of data.
You must refer to your chosen urban fieldwork location in your answer.
Name of your urban fieldwork location
Was this exam question helpful?
A group of students collected data to investigate change in Chester’s central/inner urban area.
Study Figure 3a below.
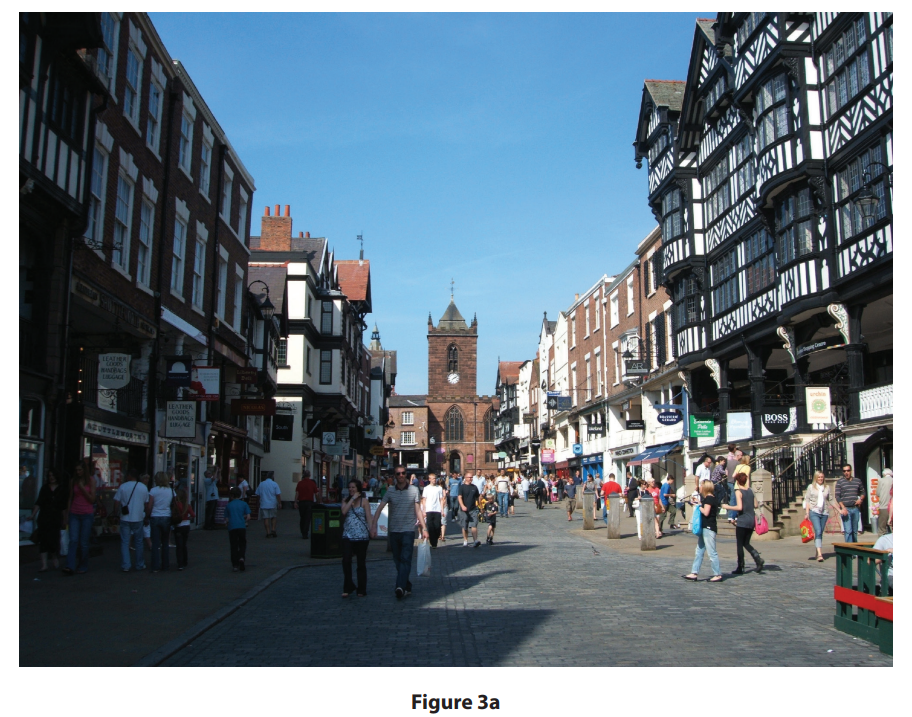
Describe one fieldwork method the students may have used at this sampling site.
Suggest one problem that the students might have experienced when collecting data at this sampling site.
Was this exam question helpful?
The students produced divided bar charts to show changes in land use.
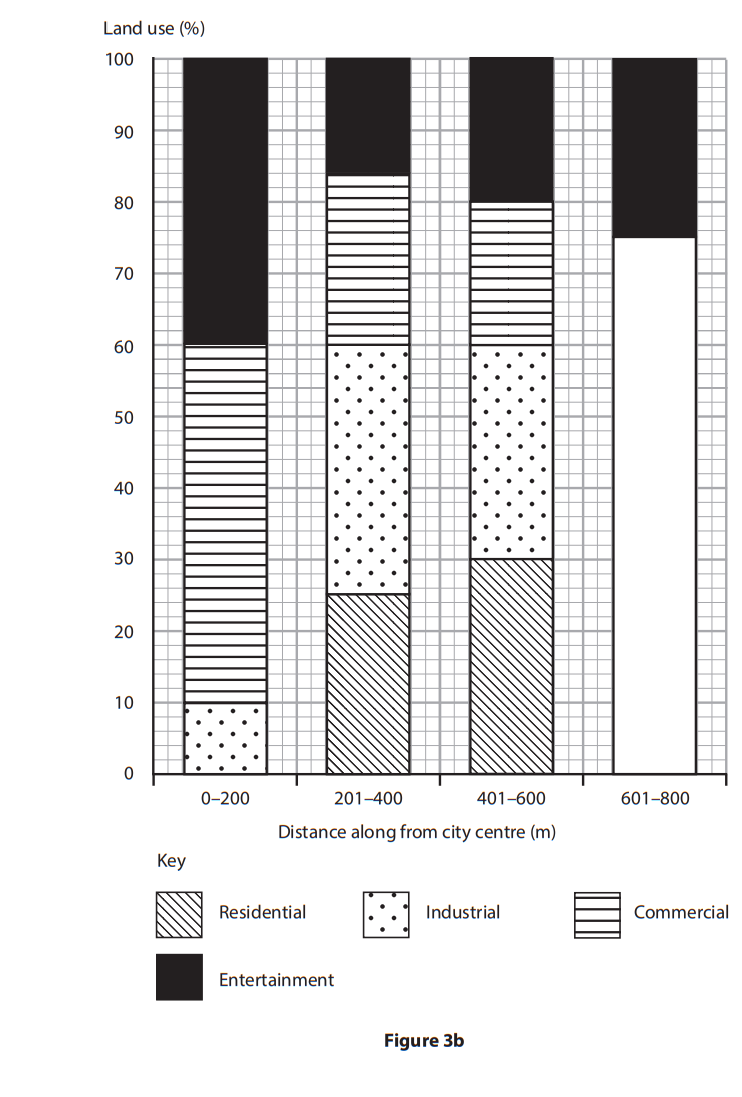
Complete Figure 3b by plotting the data below.
Land Use | Distance (m) | Percentage (%) |
|---|---|---|
Residential | 601–800 | 50 |
Industrial | 601–800 | 15 |
Commercial | 601–800 | 10 |
State one limitation of using divided bar charts to present this data.
Suggest one way this data could have been presented differently
Was this exam question helpful?