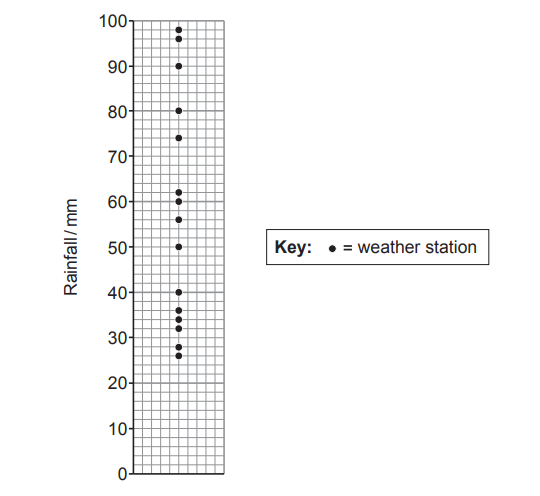
Weather & Climate (WJEC Eduqas GCSE Geography B): Exam Questions

Exam code: C112

2 hours23 questions
1
2 marks

Study the graph.

Tick (√) two correct statements in the table below. Use the graph.

Graph showing yearly rainfall in mm from 1840 to 2020, with a black line for rainfall data and a blue dashed line indicating an upward trend.
Rainfall in UK from 1836 to 2020 (mm)
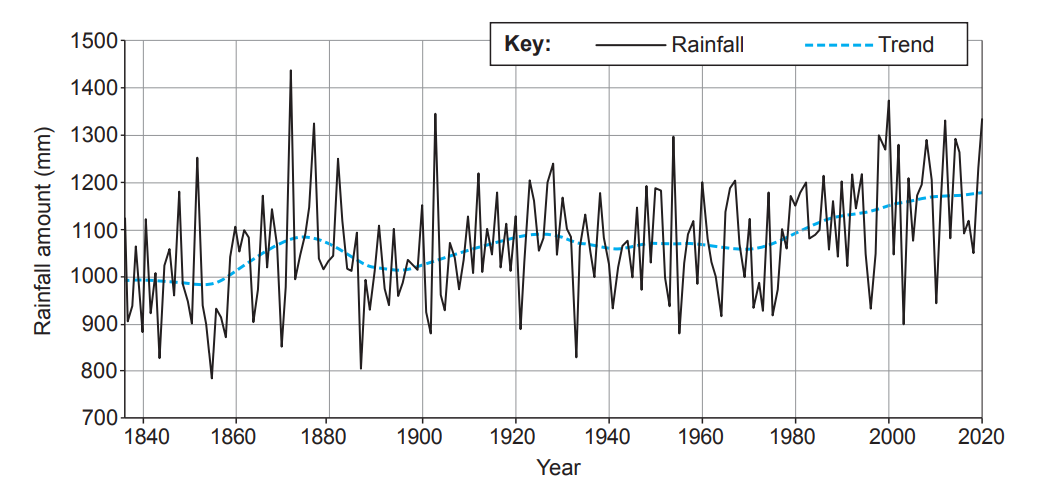
  • The four years with the highest rainfall amounts occurred before 1940.

  • The highest amount of rainfall fell in 2000.

  • The amount of rainfall decreased from 1860 until 2000.

  • The highest amount of rainfall was 1430mm.

  • The rainfall trend has increased from 1980 to 2020.

2
4 marks

Study Figure 2.1.

Weather map of the UK showing a low-pressure system with isobars, warm and cold fronts. Warm front crosses Ireland and Britain; cold front over Wales.
Figure 2.1 – Weather map of an area of low pressure (depression) over the British Isles

Complete the table below by circling the correct term in each box.

Features of a typical depression

Circle the correct term

Where are winds strongest?

warm front / warm sector / cold front

Where is air warmest?

warm front / warm sector / cold front

Where does heaviest rain occur?

warm front / warm sector / cold front

Where is rainfall the lowest?

warm front / warm sector / cold front

3
3 marks

Storm Christoph affected the UK in January 2021. Study Figure 2.2.

Map of UK showing rainfall in shades of blue: dark blue (100-150 mm), medium blue (20-99 mm), and light blue (0-19 mm), with labelled regions.
Figure 2.2 – Map showing total rainfall (mm), 18–20 January 2021

Describe the pattern of rainfall shown. Use figures in your answer.

4a
2 marks

Study Figure 2.3.

Figure 2.3 – Rainfall totals from Storm Christoph for some UK places

Place

Rainfall total, 18–20 January 2021 (mm)

Typical January rainfall (mm)

% typical January rainfall from Storm Christoph

Derwent Bridge, County Durham

86.6

75.3

115

Sale, Greater Manchester

76.6

77.2

Nantwich, Cheshire

59.2

61.9

96

Denton, Greater Manchester

78.2

82.8

94

Myerscough, Lancashire

87.0

96.8

90

Rochdale, Greater Manchester

98.6

112.2

88

Ruthin, Clwyd (Wales)

65.6

75.1

87

Westerdale, North Yorkshire

66.4

77.1

86

Calculate the percentage (%) of typical January rainfall recorded at Sale, Greater Manchester during Storm Christoph. Show your working in the box below.

Answer: ................................................... %

4b
1 mark

Select an appropriate technique from the table below to show the rainfall total and typical January rainfall in Figure 2.3.

  • Two line graphs – one for rainfall and one for typical January rainfall

  • Pie charts for each location

  • A scatter graph with a line of best fit

  • A bar chart with two bars for each location

4c
2 marks

Explain why your chosen technique is the most appropriate.

5
4 marks

Areas of high pressure (anticyclones) bring different weather conditions to the UK.

Complete the sentences below by adding the correct words from the box.

heats quickly heavy rain unstable clockwise dry

cools quickly frost anti-clockwise wet quickly

Air moves .....................................during an anticyclone in the UK. In summer, the weather during an anticyclone is usually ................................. At night in winter, the ground .................................. and there may be .................................

6
6 marks

Choose an extreme high pressure weather event outside the UK you have studied. Explain the impacts on different groups of people.

Location of event studied.............................................

7
3 marks

Study Figure 2.1 below.

Two maps of the UK show January and July isotherms with temperatures in °C at Fort William, Scarborough, London, and Penzance, marked as red dots.
Figure 2.1 – Average UK temperatures in January and July

Use the information in Figure 2.1 to complete the following sentences.

In January there is a ............................................................. °C temperature difference between Fort William and Penzance.

In July, the warmest place is ............................................................. , while Scarborough’s temperature is ............................................................. °C.

8a
1 mark

Study Figure 2.2 below.

Graph showing rainfall in millimetres from 0 to 100 with dots representing weather stations, with a key indicating dot as weather station.
Figure 2.2 – Dispersion graph showing total rainfall for September 2020 for some places in the UK

What is the median value of this rainfall data?

................................................ mm

8b
2 marks

Calculate the range of the rainfall data in Figure 2.2. Show your working in the box below.

Range = .......................................

9a
4 marks

Give two reasons why the west of the UK is wetter than the east.

9b
2 marks

The UK weather is affected by many factors including air pressure.

Circle the correct word in the sentences below.

Areas of high pressure are known as (anticyclones / depressions / hurricanes).

Areas of low pressure are known as (anticyclones / depressions / droughts).

10
6 marks

Choose one intense low pressure weather event outside the UK that you have studied. Describe the social and economic impacts of this weather event.

Name of weather event ..................................................................

11a
2 marks

Australia regularly experiences drought conditions.

Study Figure 2.3 below.

Map of Australia showing average winter rainfall. Areas range from highest on record in blue to lowest on record in red, with a detailed key.
Figure 2.3 – Average winter rainfall patterns for Australia 1999–2018

Tick (√) the two correct statements in the table below which describe the rainfall patterns shown in Figure 2.3.

  • Victoria had some areas with above average rainfall

  • South Australia had the largest area of above average rainfall

  • Western Australia had the largest area of lowest average rainfall

  • It becomes drier as you get further north

  • The north coast of Australia had more rain above average than the south coast

  • Most of the Northern Territory had below average rainfall

11b
4 marks

Droughts are becoming more frequent in many parts of the world.

Explain why two groups of people may be negatively affected by droughts.

12
4 marks

Complete the table below to describe the typical conditions of a high-pressure system by circling the one correct term in each box.

Summer

Winter

Cloud cover

None / Some / Full

None / Some / Full

Weather conditions

Rain / Windy / Sun

Frost / Windy / Rain

13
4 marks

Summer tourism in Grottole is encouraged by weather caused by high-pressure conditions.

Complete the following statements to explain why high pressure encourages summer tourism. Circle the correct term in each set of possible answers.

In areas of high pressure the air in the upper atmosphere (cools / freezes / warms). This means that the air (rises / sinks / does not move). As a result, there is less (condensation / evaporation / transpiration). The air in high-pressure areas moves slowly so the weather is (unsettled / settled / maritime)

14
2 marks

Study Figure 2.2 which shows information about how severe tropical storms (hurricanes and cyclones) are measured.

Hurricane category table shows wind speed, likely damage, and storm frequency in the USA. Categories 1 to 5 range from little to catastrophic damage.
Figure 2.2 – Saffir-Simpson Hurricane Scale.

Describe the relationship between the category of storm and the frequency with which they have occurred.

15a
2 marks

Study Figure 2.3 below. It shows the number of Category 5 storms that have occurred globally between 2010 and 2018.

Year

Number of Category 5 Storms

2010

4

2011

3

2012

3

2013

4

2014

9

2015

9

2016

8

2017

3

2018

11

Total

54

Calculate the mean number of Category 5 storms that have occurred between 2010 and 2018.

Mean number of Category 5 storms = ....................................

15b
4 marks

Increased frequency of storms leads to management challenges in coastal areas. Explain why.

16
8 marks

Study the information in Figure 2.4 below.

Collage highlighting Cyclone Idai's impact: flooded farmland, aid delivery, damaged bridge, mapped affected areas, and statistics on deaths and destruction.
Figure 2.4 – The effects of Cyclone Idai which affected the African countries of Mozambique, Zimbabwe and Malawi in March 2019.

‘The impacts of tropical storms like Cyclone Idai affect all groups of people equally.’ How far do you agree with this statement?

17
3 marks

Study Figure 2.1

Diagram showing atmospheric circulation with two convection cells, rain clouds at the equator, and Earth's surface marked from 30°N to 30°S latitude.
Figure 2.1 – Global circulation of the atmosphere

Complete the diagram by adding the correct letters from the table below to Figure 2.1. One has been done for you.

A

ITCZ (Inter tropical convergence zone)

B

Air sinks to create high pressure

C

Sun heats the Earth and air then rises to create low pressure

D

Air spreads out towards the North and South Poles

18
1 mark

One factor affecting climate is latitude. What does the term latitude mean? Tick (√) the correct answer in the box below.

  • the distance above sea level

  • the distance north or south of the Equator

  • the distance east or west of the Prime Meridian

19
4 marks

Describe the characteristics of temperature and rainfall in the hot semi-arid climate zone

20a
3 marks

Study Figure 2.2.

Weather map showing isobars over Europe and the North Atlantic; low-pressure systems with warm and cold fronts are indicated with symbols and pressure values.
Figure 2.2 – Weather (synoptic) map showing pressure systems over Europe

Use the information on Figure 2.2. Match the correct letters from the map to the statements below. Write the correct letter in the box.

Letter on map

The point with the highest air pressure

A point in the warm sector

The point with the lowest air pressure

20b
2 marks

Calculate the difference in air pressure between point S and point Z on Figure 2.2. Show your working in the space below.

............................................. millibars

20c
2 marks

Give one reason to explain why there is likely to be heavy rain at Point S on Figure 2.2.

20d
6 marks

Periods of extended high pressure can lead to impacts on different groups of people. Explain why.

21
2 marks

Explain why latitude has an impact on temperature.

22
3 marks

The Mediterranean climate, in San Diego, creates a number of challenges for people and the environment. Use Figure 2.

Graph showing monthly precipitation and temperature. Bars represent precipitation in mm, peaking in March. Line shows temperature in °C, peaking in July.
Figure 2 The Climate of San Diego, USA

Suggest one challenge for people.

One challenge for people would be:

23
3 marks

Suggest one challenge for the environment.

One challenge for the environment would be