Urban & Rural Processes & Change in the UK (WJEC Eduqas GCSE Geography B): Exam Questions

Exam code: C112

3 hours44 questions
1
1 mark

Study Graph 3.1.

Line graph showing UK population growth from 1995 to 2023, increasing steadily from 58 million to 68 million. Horizontal axis is years, vertical axis is population.
Graph 3.1: UK population change: 1995 to 2045 (estimated)

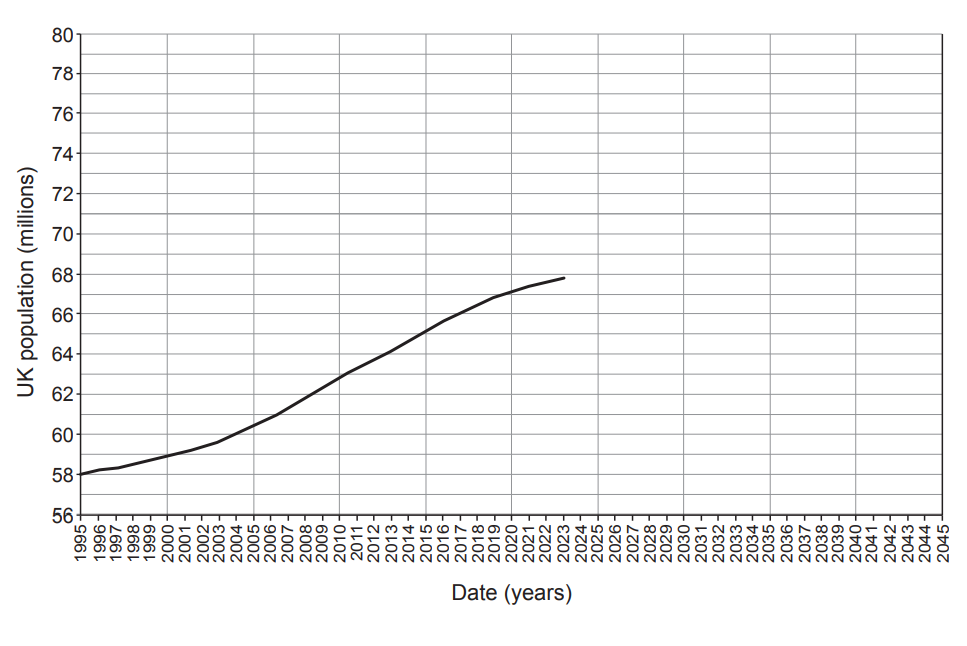
Tick (√) the correct description of the trend shown in Graph 3.1.

  • The UK population is fluctuating between 1995 and 2023

  • The UK population is decreasing between 1995 and 2023.

  • The UK population was increasing the quickest between 1995 and 2000.

  • The UK population is generally increasing between 1995 and 2023.

2
2 marks

Study Figure 1.1.

Population pyramid comparing rural and urban populations by age group; rural (purple) and urban (orange) bars show percentage distribution.
Figure 1.1 – Percentage of rural and urban populations in England in 2020

Tick (√) the two correct statements about rural and urban populations in 2020.

  • Rural areas have a higher percentage of people aged 0–4 than urban areas

  • Rural areas have a higher percentage of people aged 80+ than urban areas

  • Rural areas have a larger percentage of people aged 40–44 than urban areas

  • In rural areas the largest age group is 55–59 years old whereas in urban areas it is 20–24 years old

  • The smallest age group is 90+ in both rural and urban areas

  • The percentage of people aged 30–34 is the same for both urban and rural areas

3
2 marks

Complete the sentences using words from the text box below.

counter-urbanisation renewal brownfield

greenfield depopulation suburbanisation

In some rural areas, people have left to live in towns and cities. This process is called .............................In some rural areas, open spaces have been used to build new houses. These are called ......................................sites.

4a
2 marks

State two ways in which leisure use benefits rural areas.

4b
4 marks

Describe how leisure use has been managed in an area in the UK you have studied.

Name of UK area studied.......................................................................

5
6 marks

Explain why different groups of people might find it difficult to access services in rural areas.

6a
1 mark

Study the OS Map. The distance by road from the church with a tower at 245736 to the Scott Monument at 256739 measures 4.4cm.

Detailed street map of central Edinburgh, showing major roads, landmarks, and transport stations. A marked cathedral is highlighted at location 26, 74.
An OS Map of part of the city of Edinburgh

What is this distance in kilometres (km)? Tick (√) the correct distance in the box below.

  • 0.7km

  • 1.1km

  • 1.5km

  • 1.9km

6b
4 marks

Study Figure 1.2 below and the OS Map.
Use the OS Map to name the features shown on Figure 1.2.

Bus station Calton Hill Princes Street Gardens Queen Street Gardens

Law courts Castle Waverley Station Cathedral

Aerial view of a city featuring dense urban layout, green parks, and a central train station. Arrows point to specific locations with blank labels.
Figure 1.2 – Central Edinburgh
6c
1 mark

Area X on the OS Map is the site of the new St James Quarter Development.

Give the 4-figure grid reference for Area X:.................................................

7
2 marks

Give one reason why technology has changed the way people shop.

8
8 marks

The St James Quarter Development includes shops, restaurants, cafes and leisure facilities. It opened in June 2021 and replaces a 1960’s shopping centre and office block.

Study Figure 1.3.

Collage showcasing trams on Princes Street, Edinburgh shops, St James Quarter interior with balcony view, and overall development overview with greenery.
Figure 1.3 – Information about St James Quarter Development, Edinburgh

Analyse the advantages and disadvantages of the new development at St James Quarter, Edinburgh.

You should use evidence from the OS Map and Figures 1.2 and 1.3 to support your answer.

Aerial view of a city layout with multiple neighbourhoods, roads, and green spaces. Labels and arrows point to specific locations on the map.
Figure 1.2 – Central Edinburgh
Detailed map of Edinburgh city centre with roads, rail lines, and landmarks, including Waverley Station and Edinburgh Castle. Scale and compass included.
An OS Map of part of the city of Edinburgh

Your ability to spell, punctuate and use grammar and specialist terminology accurately will be assessed in your answer to this question.

9a
6 marks

Explain why some people move from rural to urban areas in the UK.

9b
1 mark

Give two reasons why rural to urban migration can have an impact on UK urban areas.

10
2 marks

Give one reason why having a minimum hourly wage could reduce deprivation.

11
1 mark

Many UK cities have zones where there is a mix of different ethnic groups of people.

Tick (√) the box below which gives the correct term for the zones of a city where there is a mix of different ethnic groups.

  • Multipurpose

  • Multinational

  • Multiplier

  • Multicultural

12
2 marks

Study Figure 1.2 below. It shows a transect through the UK city of Bristol with the percentages of Black, Asian and Minority Ethnic population.

Map of Bristol showing areas with varying percentages of Black, Asian, and Minority Ethnic populations, city centre marked, inset shows UK location.
Figure 1.2 – Transect through Bristol showing percentage of Black, Asian and Minority Ethnic population

Suggest two weaknesses of Figure 1.2 to show the information.

13
2 marks

A student used data on languages spoken in Bristol (other than English) to produce this word cloud (Figure 1.3). The size of the word is proportional to the number of speakers of that language.

Word cloud showcasing various languages, with "Polish" and "Somali" in largest font. Other languages include Chinese, Spanish, Urdu, Panjabi, and Arabic.
Figure 1.3 – Word cloud of languages, other than English, spoken in Bristol

Give two other appropriate techniques to display this information.

14
8 marks

Study Figure 1.4 below which shows the Queen Elizabeth Olympic Park in London. This was developed for the 2012 Olympic Games.

Aerial view of a large stadium with a circular canopy surrounded by urban landscape, with a red sculpture and green spaces nearby.
Figure 1.4

Fact Box

  • The Olympic Park includes the Olympic (London) Stadium and other buildings and parklands.

  • Built on 200 hectares of toxic wasteland using 25% recycled materials.

  • Events held at the stadium since 2012 include World Athletics, Women’s Hockey World Cup, Rugby World Cup.

  • West Ham United Football Club pay £2.5 million a year to rent the converted Olympic Stadium.

  • Stadium expected to lose £140 million of public money over the next decade.

  • More than 23 million people have visited the Olympic Park since 2012.

  • Local transport links improved.

  • High unemployment and lack of affordable housing in the surrounding area of East London.

Analyse the impacts of holding major sporting events in the UK such as the London 2012 Olympic Games.

You may also use examples you have studied to support your answer.

Your ability to spell, punctuate and use grammar and specialist terminology accurately will be assessed in your answer to this question.

15
6 marks

The proportion of people in rural areas is declining. Explain why.

16
4 marks

The population of Grottole has fallen from 1400 to 300 in the past thirty years.

Give two reasons why a decrease in population in a rural area affects those who stay.

17
2 marks

Give one reason why good communication links can bring economic advantages to an area.

18a
6 marks

Study Figure 5. Grottole has become a tourist honeypot. The number of holiday homes in the village has increased in recent years.

Collage promoting Grottol with a scenic view, rental interiors, and a charming stone street, encouraging holiday bookings. Social icons at bottom.
Figure 5 – Some of the houses in Grottole are being rented out as holiday homes.

Explain the possible problems this could cause.

18b
1 mark

Suggest one advantage that an increase in tourism could bring to the village of Grottole.

19a
6 marks

Explain why retail provision is changing in the UK.

19b
6 marks

Online (internet) shopping can have social and economic impacts. Explain why.

20a
1 mark

Study Figure 1.1 below.

Side-by-side bar charts show age distribution in London and Blackpool from 0-17 to 65+, with percentages ranging up to 30%.
Figure 1.1 – Age structure of two UK urban areas

Complete the graph for Blackpool by drawing the bar to show the following:

0–17 yr olds

20%

20b
3 marks

Compare the age structure of London and Blackpool. Use figures in your answer

21
4 marks

There are a number of processes that contribute to urban change in the UK. Read the definitions below.

Letter

Definition

A

The outward spread of a city

B

The movement of people from large cities to small towns and villages

C

The reuse of derelict land in a city

D

The movement of people back to cities

Add the letter of the correct definition to each of the following terms below.

Term

Letter

Suburbanisation

Re-urbanisation

Counterurbanisation

Infill

22
4 marks

Over 33% of London’s population are international migrants.

Explain why international migration can have social and economic consequences for urban areas in the UK.

23
2 marks

Calculate the percentage change in the population of Australasia between 2020 and 2100.

World map showing the 2020 population distribution: Asia 4.6B, Africa 1.3B, Europe 748M, North America 369M, South America 654M, Australasia 43M.
Figure 1.2 – Estimated changes in world population between 2020 and 2100.
World map showing projected 2100 population by continent: Asia 4.7B, Africa 4.3B, Europe 630M, South America 680M, North America 491M, Australasia 75M.
Figure 1.2 – Estimated changes in world population between 2020 and 2100.

Show your working below.

24a
6 marks

Some villages in the UK are experiencing an increase in population. Explain why.

24b
4 marks

Give two reasons why population growth can cause positive impacts in rural areas.

25
2 marks

Some people think that new housing should be built on brownfield sites. Give one reason why.

26a
2 marks

The pattern of how and where we shop in the UK is changing.

Study Figure 1.1 below.

Aerial view of a proposed retail park near A6108 and A66 junctions, highlighting road connections to A1(M) with annual road user statistics.
Figure 1.1 – The proposed Scotch Corner Retail Park in North Yorkshire

Suggest two reasons why this is a suitable site for a retail park. Use evidence from Figure 1.1 only.

26b
4 marks

The Scotch Corner development is on a ‘greenfield’ site.

Explain why developers often prefer greenfield sites to brownfield sites.

27
1 mark
Rectangular site plan featuring buildings and green spaces, outlined in red. Adjacent roads and rail tracks shown, with a north arrow and scale bar.
Figure 1.2 – A plan of the retail park

Study Figure 1.2 . Calculate the approximate area of the new retail park. The edge of the retail park is shown in red. Choose the correct answer from the box below.

  • 250000 square metres

  • 200000 square metres

  • 100000 square metres

28
4 marks

Complete the sentences that follow, using four words or phrases from the text box below.

threshold low value retail high value

travel catchment convenience commute

The range is the distance a shopper is prepared to .........................................

People will travel further for ........................................................ goods.

The area a shop gets its customers from is called the .......................................

The minimum population needed for a service such as a shop is called the ..............................................

29
4 marks

Explain why out of town retail parks are attractive to shoppers.

30
3 marks

Study Figure 1.3.

Line graph showing rise in online shopping from 2008 to 2018, with ages 25-34 reaching over 90%, and ages 65+ near 50% in 2018.
Figure 1.3 – Changing patterns of online shopping 2008-2018

Compare the changing pattern of online shopping of people aged 25-34 with that of people 65+.

31
2 marks

Study Figure 1.4.

Figure 1.4 – Frequency of online shopping over a three-month period

Frequency

Age group %

Age 25-34

Age 65+

Once or twice

17

29

3-5 times

27

28

6-10 times

19

23

11 times or more

37

20

Give two reasons why a bar graph is an appropriate technique to represent this data.

32
4 marks

Describe the economic and environmental impacts the growth of online shopping is having on town centres (CBDs) in the UK.

33
12 marks

Study the photos below which show some honeypot sites in the UK.

A beach in the south west of the UK
Figure 1.5 A beach in the south west of the UK
Busy street in a quaint village with historic stone buildings, cars parked along the road, and a scenic countryside backdrop under a partly cloudy sky.
Figure 1.6 A village in rural England
Four people hiking up a grassy hill with trekking poles, overlooking a scenic valley and distant hills under a cloudy sky.
Figure 1.7 A footpath in a UK National Park

Analyse the likely positive and negative impacts of honeypot sites on both local residents and leisure users.

[8]

Use evidence from the photographs. You may also use examples you have studied to support your answer.

Your ability to spell, punctuate and use grammar and specialist terminology accurately will be assessed in your answer to this question.

[4]

34
2 marks

The city of Valencia in Spain is facing a difficult decision about its water supply. The city has many of the same challenges as San Diego and Perth.

  • the population is increasing

  • the Mediterranean climate has natural periods when water supply is short

  • the city has a growing tourist industry

Illustration of a person with speech bubbles discussing the impact of climate change on tourism, and concerns about water shortages in the city.

Suggest why the tourist industry has a large water footprint.

35
6 marks

Explain why counter-urbanisation is happening in some parts of the UK.

36
6 marks

Explain why so many commuters choose to use cars for their journey to work.

37
3 marks

Most towns and cities in the UK have distinctive zones. One of these is the zone of deprivation.

Tick (√) three features in the list below which are indicators of deprivation.

  • Low crime rate

  • High level of car ownership

  • High level of overcrowding

  • Low level of employment

  • High level of income

  • Low level of good health

38
4 marks

Study Figure 1.1 below.

Map of Newcastle showing areas by deprivation level: red for most deprived, yellow for least deprived, with the city centre marked by a star.
Figure 1.1 Levels of deprivation in the city of Newcastle-upon-Tyne, NE England

Describe the pattern of deprivation shown on this map.

39
1 mark

Tick (√) which of the following statements best describes the land use of the CBD (Central Business District).

  • Mainly small factories and warehouses

  • Mainly shops, offices and restaurants

  • Mainly retail parks and leisure centres

  • Mainly new housing estates

40
1 mark

Many cities have high volumes of traffic. Study Figure 1.2 below.

Diagram of intersection at CBD with Northgate Street, Eastview Road, Southpark Drive, and Western Avenue. Hexagonal icons represent vehicle numbers.
Figure 1.2 The flow of traffic into and out of a CBD between 9.00am and 9.05am.

The amount of traffic flowing out of the CBD at Point A between 9.00am and 9.05am was 100 vehicles.

Which of the arrows in the table should be used to show the traffic at Point A on Figure 1.2? Tick (√) the correct box.

  • A
  • B
  • C
  • D
41a
3 marks

Complete the table below to show information for traffic going into the CBD:

  • names of roads in rank order of number of vehicles

  • the number of vehicles on each of the roads

  • the total number of vehicles going into the CBD.

Rank Order

Name of Road

Number of vehicles

Highest

^
|

|

|

v

Lowest

Western Avenue

125

...................................

............................

Southpark Drive

............................

....................................

50

Total...................................

41b
4 marks

Large volumes of traffic going into the CBD has led to pedestrianised zones in some UK cities.

Suggest one advantage and one disadvantage of creating pedestrianised zones in a city centre.

42
1 mark

Give one reason why the population of cities in the UK is increasing

43
6 marks

Explain why improving transport systems can help to make cities more sustainable.

44
12 marks

Study the information below. They show some features of urban and rural areas of the UK.

Line graph showing average property prices in £ from 2007 to 2017, with rural prices consistently higher than urban prices.
Figure 1.3 Changes in house prices 2007-2017
Table comparing urban and rural areas: population percentage, work status, access to a doctor's surgery, and superfast broadband connectivity.
Figure 1.4 Urban and rural comparisons
The Little White Bus parked on a rural road beside stone buildings, driven by a person, promoting community-run services in rural areas.
Figure 1.5 Changes to rural services

What conclusions can you reach about the social and economic issues facing rural areas of the UK?

[8]

Your ability to spell, punctuate and use grammar and specialist terminology accurately will be assessed in your answer to this question.

[4]