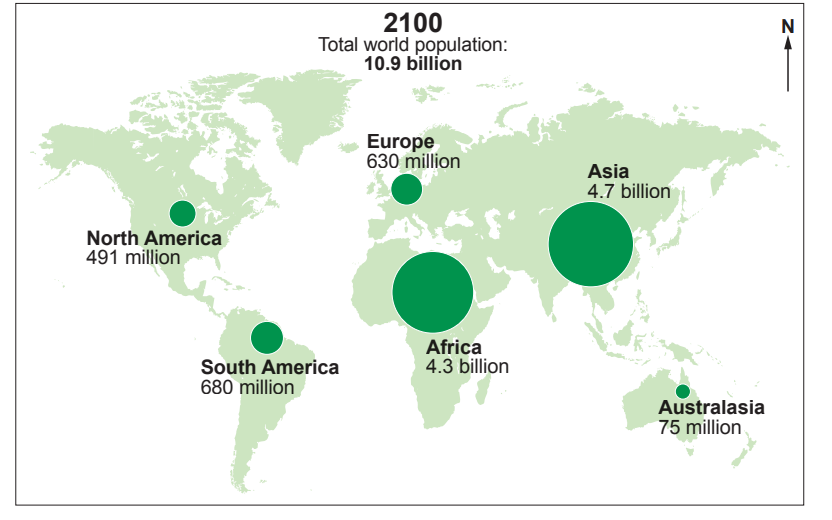
Urbanisation in Contrasting Global Cities (WJEC Eduqas GCSE Geography B): Exam Questions

Exam code: C112

1 hour17 questions
1a
4 marks

Study Figure 1.1.

Figure 1.1: Expected location of the world’s largest cities in 2050 and 2100

Map of major global cities projected to have populations over 25 million by 2050, marked by varying sized pink circles indicating population size.
Figure 1.1: Expected location of the world’s largest cities in 2050 and 2100
Map of projected city populations in 2050, showing major cities worldwide with varying circle sizes indicating population size, including Tokyo and Lagos.
Figure 1.1: Expected location of the world’s largest cities in 2050 and 2100

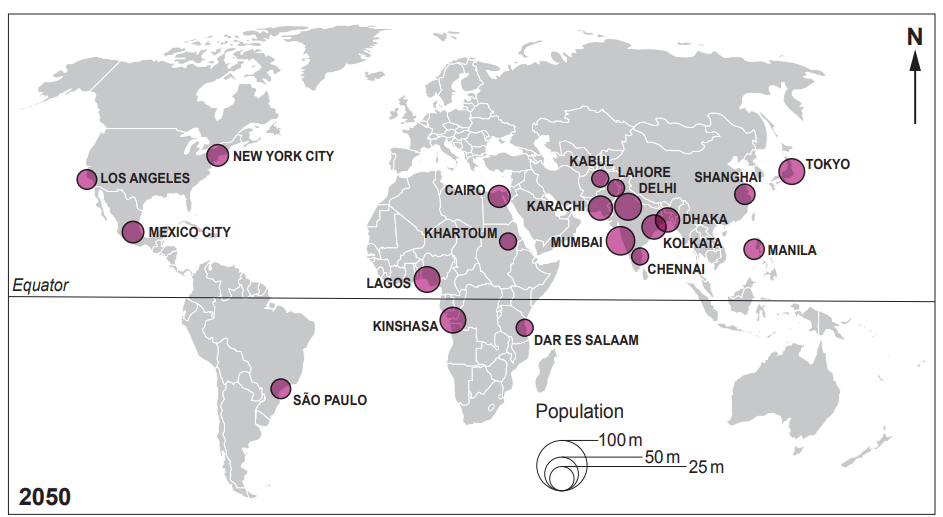
Describe the pattern of expected changes in the location of the world’s largest cities shown in Figure 1.1.

1b
2 marks

One of the world’s fastest growing cities is estimated to be Lagos in Nigeria.

Year

Population

2022

15 million

2035

24 million (estimated)

Calculate the estimated percentage population increase for Lagos between 2022 and 2035. Show your working.

.................................................... % increase

1c
4 marks

Explain two reasons why cities in LICs and/or NICs are growing so rapidly

2
4 marks

Describe how a city in a LIC/NIC you have studied is tackling housing problems.

Name of city in LIC/NIC ...................................................................... .

3a
1 mark

Study Figure 1.

Map of Southeast Asia with major cities and countries labelled, highlighting Indonesia. Inset shows location on a global map within the tropics.
Figure 1 – The location of Jakarta

Describe the location of Jakarta

3b
2 marks

Study Figure 2 . It shows Jakarta’s population growth.

Line graph showing population growth from 1870 to 2020, with a steep increase after 1950, reaching over 10 million by 2020.
Figure 2 – Population Growth in Jakarta

Describe the changes in Jakarta’s population between 1870 and 2020.

3c
4 marks

Population growth like this can cause problems for urban areas. Give four potential problems.

3d
1 mark

Explain why cities benefit from population growth.

4
4 marks

Study Figure 4.

Diagram showing aquifer depletion causing land subsidence and flooding in urban areas. Key includes rock types, extraction wells, and sea wall.
Figure 4 – A cross-section diagram of Jakarta

Suggest why Jakarta is sinking.

5a
2 marks

Moving the capital city could allow areas of poor quality housing in Jakarta to be cleared.

Explain one advantage of removing poor quality housing for governments.

5b
2 marks

Explain one problem removing poor quality housing will have for the people that live there.

6
2 marks

Urbanisation has contributed to population change on a global scale. Study Figure 1.2 below.

Figure 1.2 – Estimated changes in world population between 2020 and 2100

World map showing 2020 population: Asia 4.6 billion, Africa 1.3 billion, Europe 748 million, North America 369 million, South America 654 million, Australasia 43 million.
Figure 1.2 – Estimated changes in world population between 2020 and 2100
World map showing projected 2100 populations: Asia 4.7B, Africa 4.3B, South America 680M, Europe 630M, North America 491M, Australasia 75M. Total 10.9B.
Figure 1.2 – Estimated changes in world population between 2020 and 2100

Complete the sentences by adding the correct information from the box below.

3.6 Europe 7.8

Asia 3.1 North America

By 2100, the world’s population will have increased by ......................billion.

The continent which will have a decrease in population is .................... .......

7a
4 marks

Rapid urbanisation is taking place in some parts of the world. Give two reasons why

7b
4 marks

One challenge of urban growth is waste disposal.

Describe how one global city you have studied is dealing with the problem of waste disposal.

Name of global city ..........................................................................................

8
8 marks

Both slum clearance and self-help schemes are possible solutions to housing problems in LICs/NICs.

Study Figure 1.3 below.

Four images depicting housing schemes: slum clearance in China and India, self-help construction in Kenya, and loan-built house in Cambodia.
Figure 1.3 – Slum clearance and self-help housing schemes.

Do you consider slum clearance schemes or self-help schemes to be the better option? Justify your choice.

Refer to both types of scheme in your answer.

Your ability to spell, punctuate and use grammar and specialist terminology accurately will be assessed in your answer to this question.

9
6 marks

Study Figures 5.1–5.4.

Busy city street with heavy traffic, including cars, buses, rickshaws, and motorbikes; pedestrians are weaving through vehicles, and trees line the road.
Figure 5.1 – Traffic congestion in an old district of New Delhi (India).
Cityscape with modern skyscrapers in the foreground and smaller buildings in the background, under a blue sky with light clouds.
Figure 5.2 – New apartment blocks on the outskirts of São Paulo (Brazil) New highways connect the area with the city centre 20 miles away.
Busy urban street scene with numerous motorbikes and people navigating traffic near a school gate under power lines and signage.
Figure 5.3 – Commuters in Ho Chi Minh City (Vietnam) face many dangers as they travel to work across the city.
A busy multi-lane motorway lined with trees and high-rise buildings in the distance under a clear sky, showcasing urban traffic and billboards.
Figure 5.4 – New highways connect expanding Business Parks on the outskirts of Jakarta (Indonesia).

‘The problems caused by the growth of traffic in global cities are a price worth paying.’

How far do you agree with this statement?

Use Figures 5.1–5.4 to support your answer. You may also refer to examples you have studied

10a
2 marks

Some global cities in developing countries have built mass transit schemes.

Give one reason to explain why such schemes are important for rapidly growing cities.

10b
4 marks

Give two reasons why some global cities in LICs/NICs find it difficult to build mass transit schemes.

11
4 marks

All three cities have experienced rapid growth in the last 40 years.

City

Population (in millions)

1979

2019

% increase in 40 years

San Diego

1.5

1.9

26.67%

Perth

1.6

2.1

31.25%

Valencia

1.4

1.7

Much of the growth of the three cities can be explained by migration.

Describe what effects migration has had on a city in a HIC.

12
4 marks

Study Figure 3.

Map showing Nairobi's urban boundary with slums marked in red, blue, and black, and green areas denoting woodlands. Central business district in yellow.
Figure 3 The pattern of slums distributed across Nairobi

Describe the pattern of slums located in Nairobi. Fill in the gaps using four of the words in the box below

two focused western woodland Nairobi

one concentrated northern Kibera

scattered three eastern Mathare

The slums are ................................ across the city, but there are none near the ..................................boundary. The cluster of slums to the south west of the CBD are collectively known as the ..................................... district. One of the newest slums, Dagoretti, is .............................. km from the CBD.

13
4 marks

Study Figure 4. The Mathare slum is one of the oldest slums in Nairobi.

View of a densely populated informal settlement with tin-roofed shacks, scattered people, electrical poles, and urban skyline in the background.
Figure 4 The Mathare slum, one of the oldest in Nairobi

Use evidence from the photograph to show how peoples’ lives can be improved over time in slum areas such as this.

14
3 marks

Study Figure 5. shows the centre of Nairobi, an example of a global city.

Skyline of a city with modern skyscrapers and historic buildings, surrounded by green trees under a partly cloudy sky.
Figure 5-The centre of Nairobi, an example of a global city.

List three features common to all global cities.

15
4 marks

Fact Box

The authorities in Nairobi struggle to keep pace with the rate of migration into the city.

➢ The rate of internal migration within Kenya continues to rise.

➢ Nairobi has limited funds to improve the slums. Some large-scale projects such as slum clearance schemes have been used, but these only touch a small proportion of the population.

Describe how a slum clearance scheme in a NIC or LIC you have studied affected people living there.

Name or location of the slum clearance scheme:

16a
3 marks

Fact Box

Charities in Nairobi work to help those not fortunate enough to benefit from large-scale projects.

➢ Small-scale charity projects involve health, self-help work creation and education schemes (development aid).

➢ Limited funds mean that they need to focus on small areas, often in the newest slums.

➢ The most successful projects are phased (staggered) over a period of time.

Study Figure 7. It gives information about a smallscale health project.

Health programme flyer showing vaccination plans, stagnant water draining, and mosquito net distribution in a growing Nairobi slum to fight diseases.
Figure 7: A small-scale health project

Suggest one reason why it is difficult to set up vaccination programmes in rapidly growing cities such as Nairobi.

16b
3 marks

Poor waste disposal contributes to problems including the spread of malaria.

Use evidence from Figure 7 to suggest why it will be difficult to overcome the problem of malaria in slums.

17
4 marks

Give two reasons to explain why self-help schemes are likely to succeed.