1
3 marks
Study Figure 1.

Describe the global pattern of vulnerability to desertification.
Was this exam question helpful?
Exam code: C112
Study Figure 1.
Describe the global pattern of vulnerability to desertification.
Was this exam question helpful?
Bahrain has a hot, semi-arid climate. Circle the three features of hot, semi-arid climates.
a short wet season a temperature range higher than 40°C a maximum temperature around 20°C hot summers cold winters low annual precipitation |
Was this exam question helpful?
Study Figure 1.
It also shows the location of four countries vulnerable to desertification.
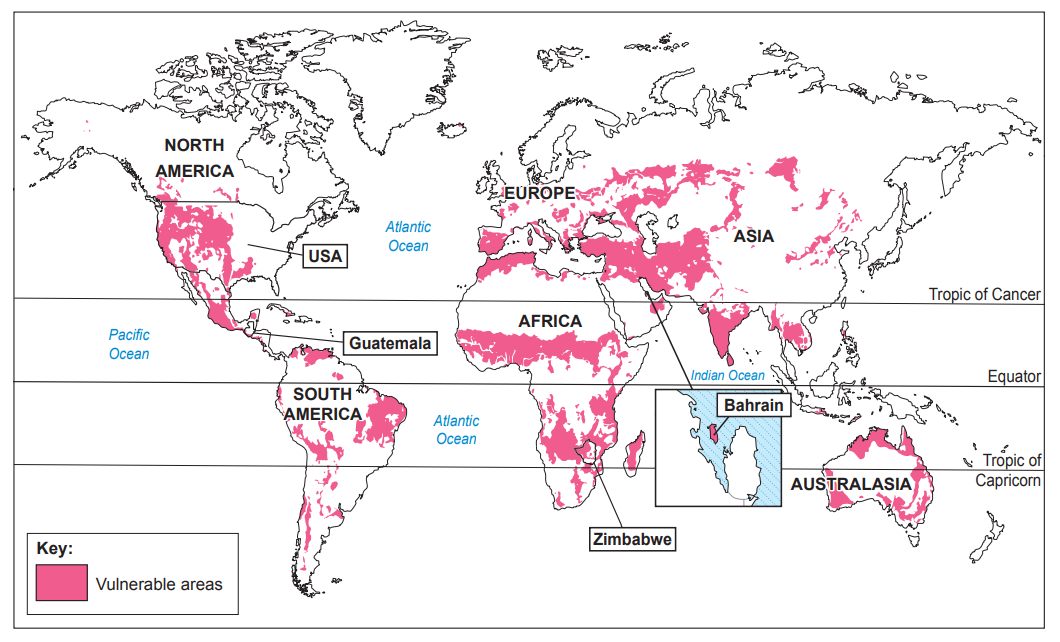
Bahrain is one of the four countries vulnerable to desertification named on the map.
Describe the location of Bahrain.
Bahrain is a newly industrialised country (NIC).
Give two characteristics of a NIC.
Was this exam question helpful?
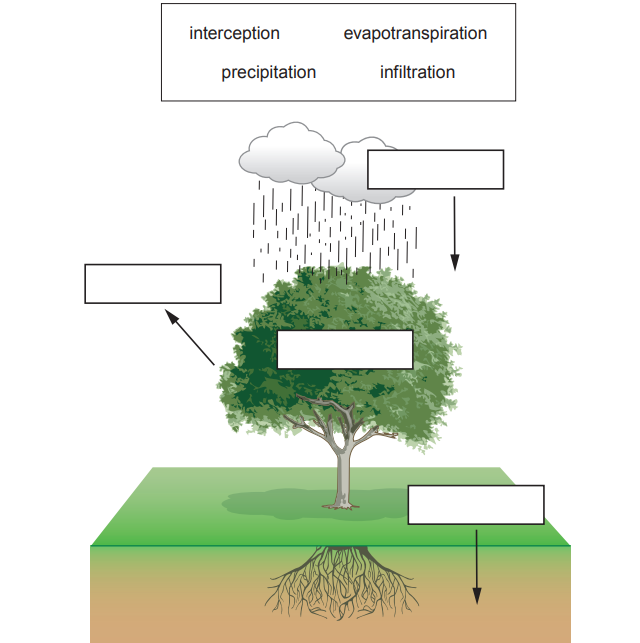
Complete the diagram below to show how trees affect the flow of water in the local environment. Use words from the text box below.
Was this exam question helpful?
Deforestation is a human activity that can lead to desertification.
Give one reason why people cut trees down.
Was this exam question helpful?
Study Figure 2 . It shows the rate of forest only cover change.
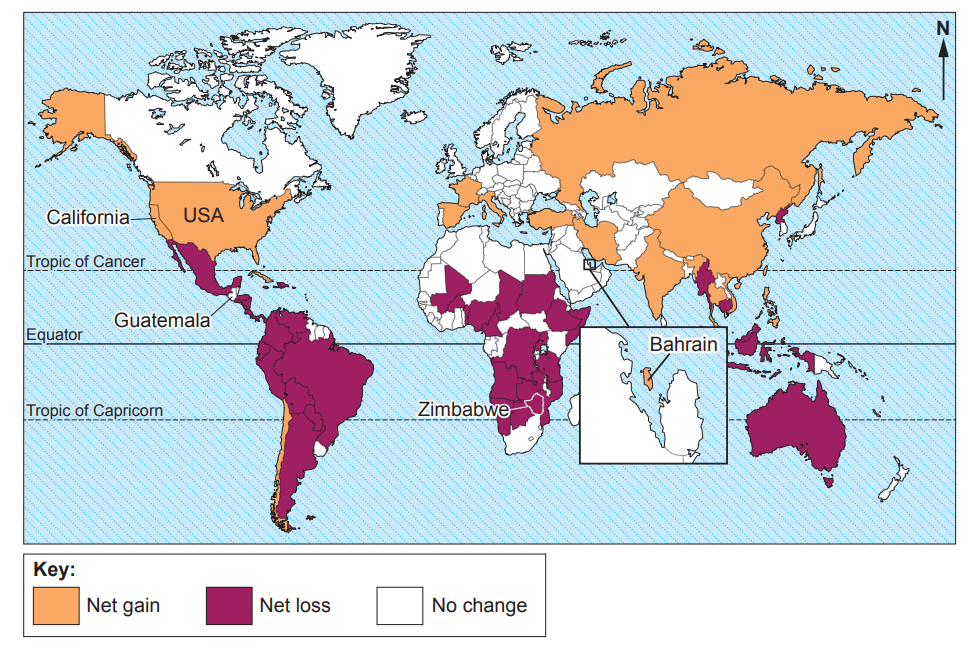
Circle the correct word in each sentence below using Figure 2.
Since 1990, Bahrain forest cover (increased / decreased / stayed the same).
Most countries that lost forest are (east / north / south) of the Tropic of Cancer.
Was this exam question helpful?
Explain two other ways poor land management can make desertification worse.
Was this exam question helpful?
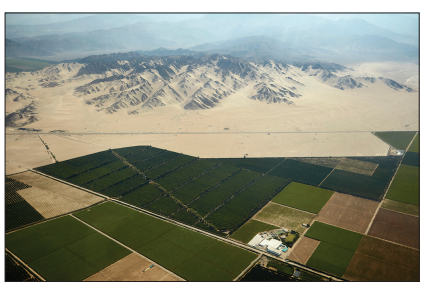
Study Figure 4.
California’s farmers are using advanced technology to produce crops.
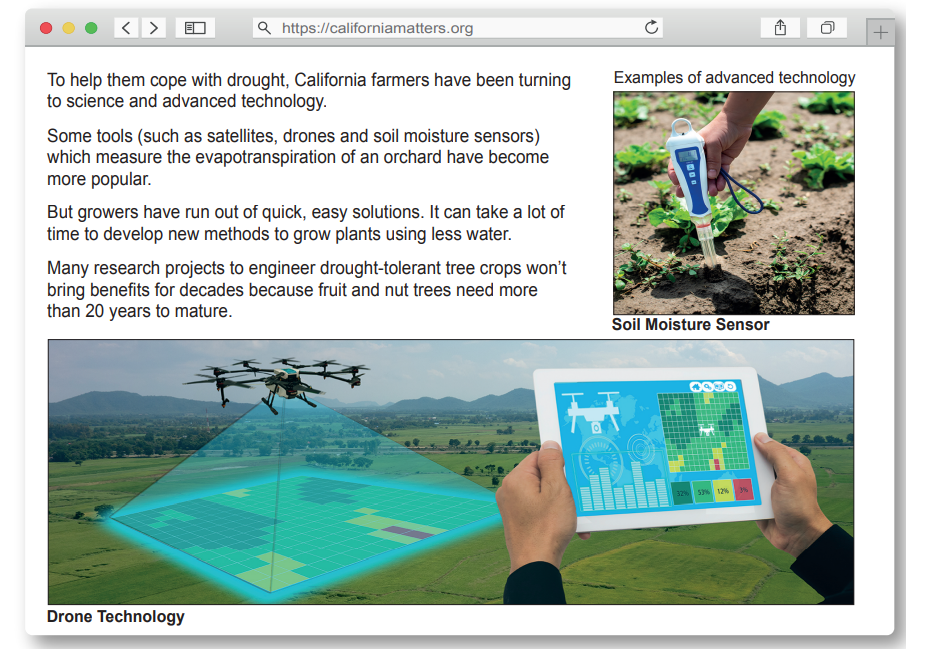
Suggest how advanced technology might help California to manage desertification.
Suggest why using advanced technology is not an option for some farmers.
Was this exam question helpful?
Study Figure 5.
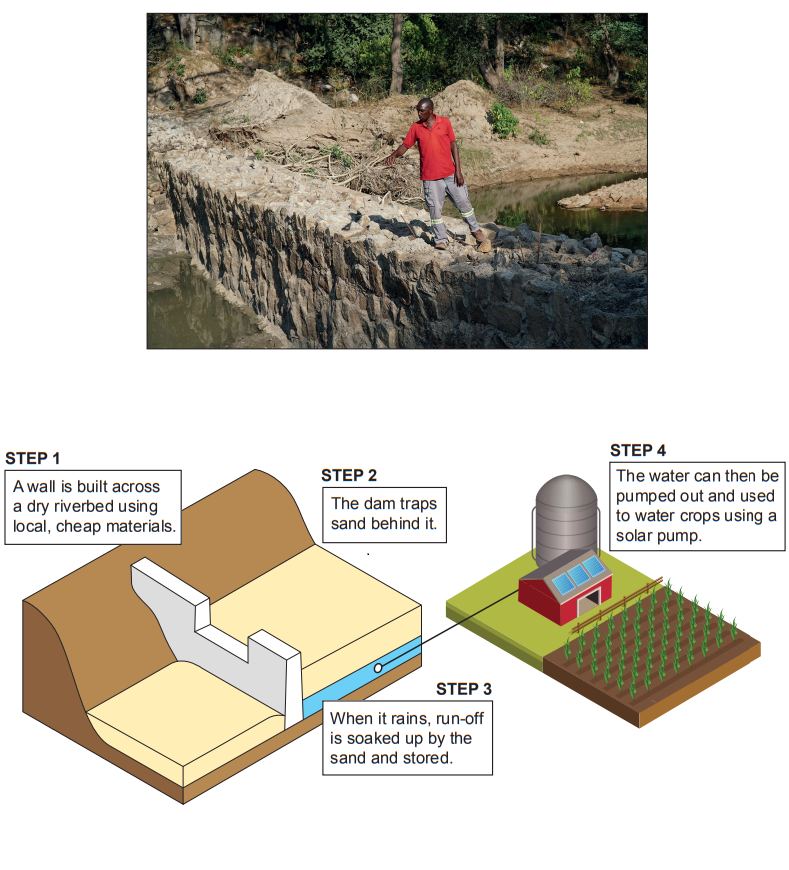
Zimbabwe, a country in Southern Africa, is suffering from desertification and is asking its farmers to build more sand dams.
Evaluate how sand dams could be considered sustainable.
Was this exam question helpful?
Study Figure 6.
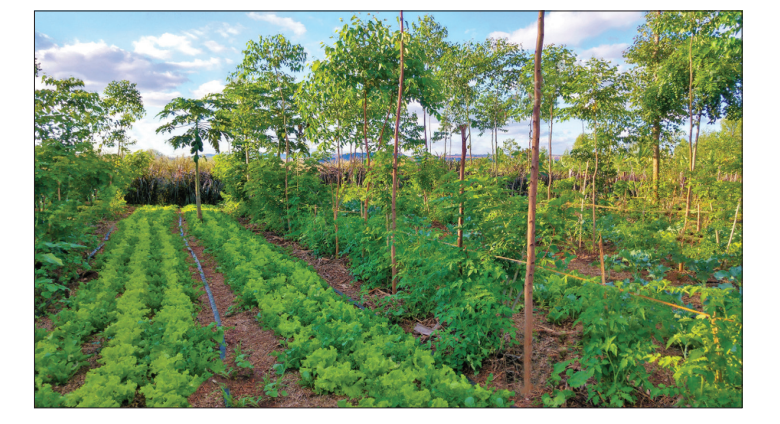
The country of Guatemala, in Central America, is also suffering from desertification. Farmers are using drought-tolerant crops.
Give one reason why drought-tolerant crops may help to reduce desertification.
Explain why local communities could benefit from the planting of drought-tolerant crops.
Was this exam question helpful?
The country of Bahrain has experienced more desertification in recent years than ever before. Which one of the three options should Bahrain choose to reduce the effects of desertification?
Use advanced technology.
Install sand dams.
Farm more drought-tolerant crops.
Justify your decision.
Your answer should consider the social, economic and environmental sustainability of your decision.
You may use the resources from this paper as well as your own studies. [12]
Your ability to spell, punctuate and use grammar and specialist terminology accurately will be assessed in your answer.
I have chosen to ..................................................................................
Was this exam question helpful?
Many hot semi-arid areas suffer from desertification. Choose the correct terms from the box below to complete some definitions linked to desertification.
microclimate transpiration interception evaporation evapotranspiration precipitation macroclimate desiccation |
........................................................ is the process where water changes from liquid to vapour.
........................................................ is the process where water is trapped by plants.
........................................................ is the process where water is lost to the atmosphere from the surface and from plants.
........................................................ is the pattern of temperature and rainfall affecting a small area.
Describe two ways human activity damages hot semi-arid areas.
Was this exam question helpful?
Work to reduce desertification is often done through Non-Government Organisations (NGOs). Explain one advantage and one disadvantage of this for the local community.
Was this exam question helpful?
Desertification is a growing problem for many countries.
Explain why cutting down trees can lead to desertification.
Was this exam question helpful?
There are many ways to reduce the impact of desertification.
Study Figure 4.3 below.
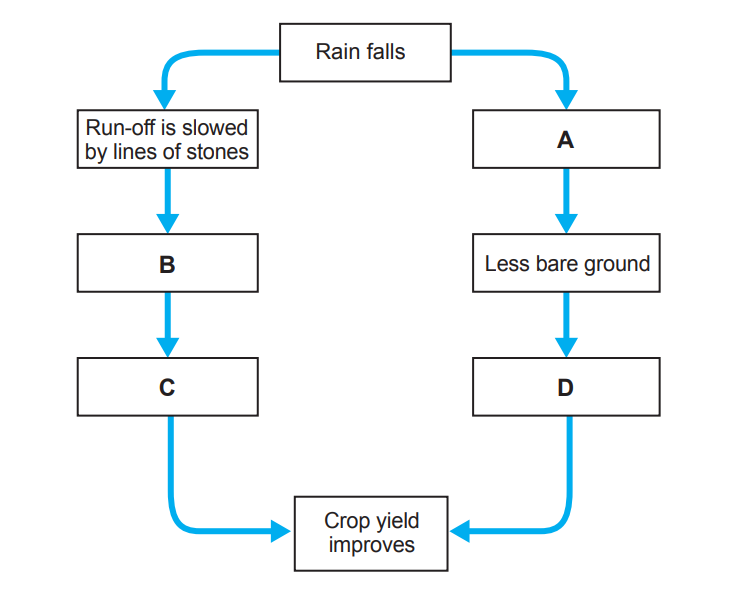
Complete the table below, adding the correct letter from Figure 4.3 next to the statement.
Statement | Letter from Figure 4.3 |
Plants have more water | ...................................... |
Stones trap soil | ...................................... |
Plants have more nutrients | ...................................... |
More rain infiltrates to recharge the soil | ...................................... |
Was this exam question helpful?
Study Figure 4.4 below.
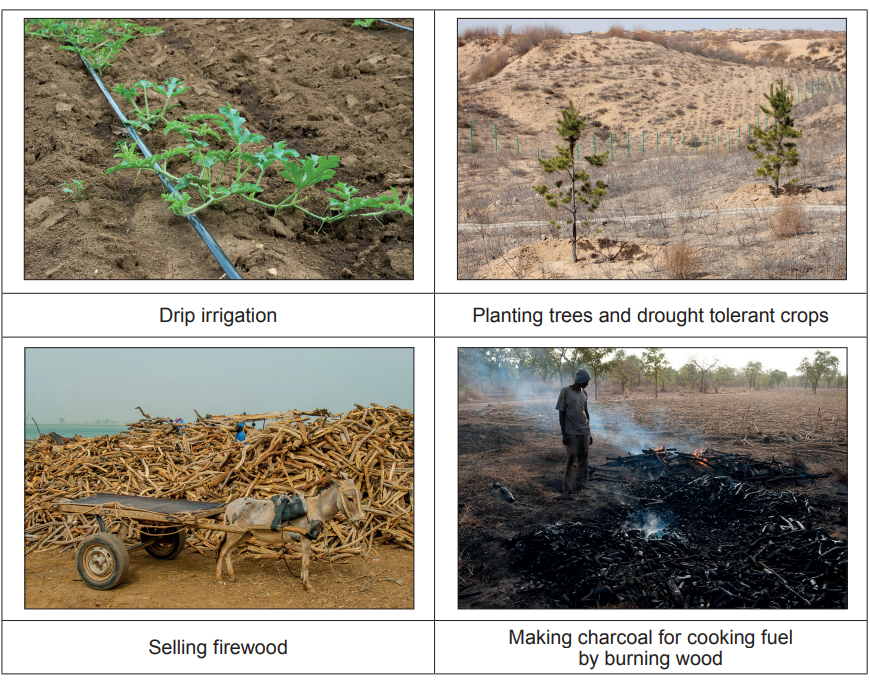
‘The economic benefits are more important than environmental costs when managing desertification.’ How far do you agree with this statement?
You may use the resources in Figure 4.4 and/or examples you have studied to support your answer.
Was this exam question helpful?
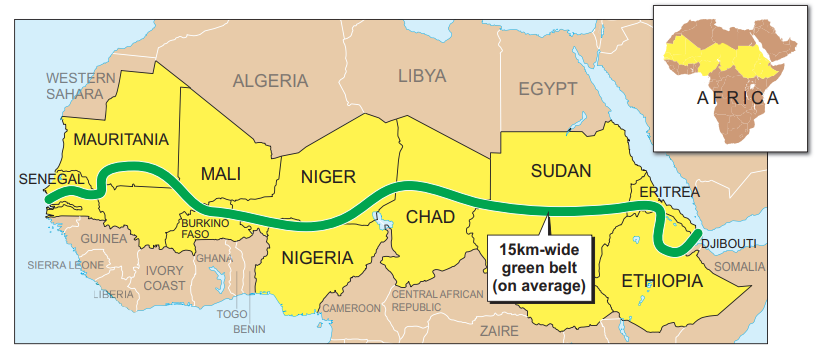
Study Figure 3.1 below.
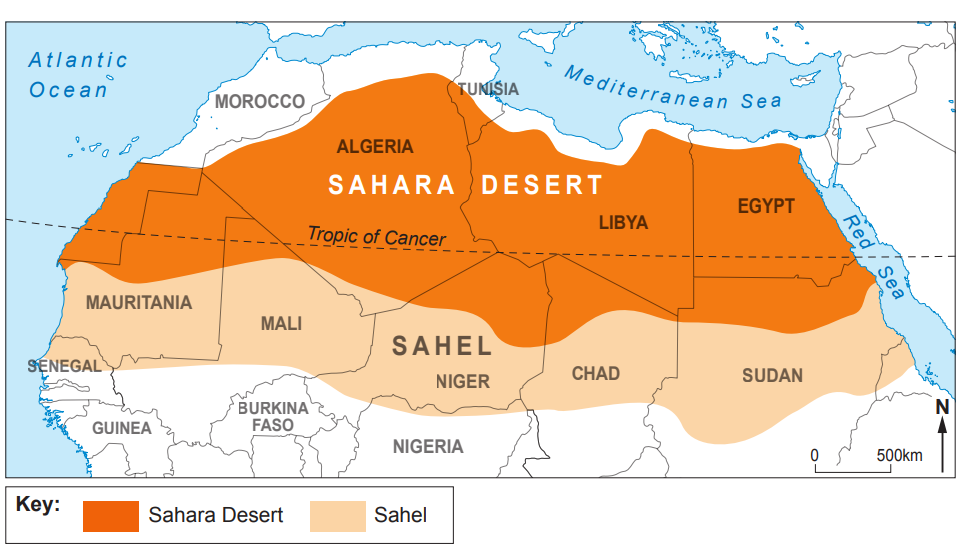
Use the information in Figure 3.1. Tick (√) the two correct facts about the location of the Sahel in the table below.
North of the Tropic of Cancer
South of the Sahara Desert
Extends from the Atlantic Ocean to the Mediterranean Sea
Includes parts of Mali, Chad and Egypt
North of Burkina Faso
South of Nigeria
Was this exam question helpful?
Study Figure 3.2 below
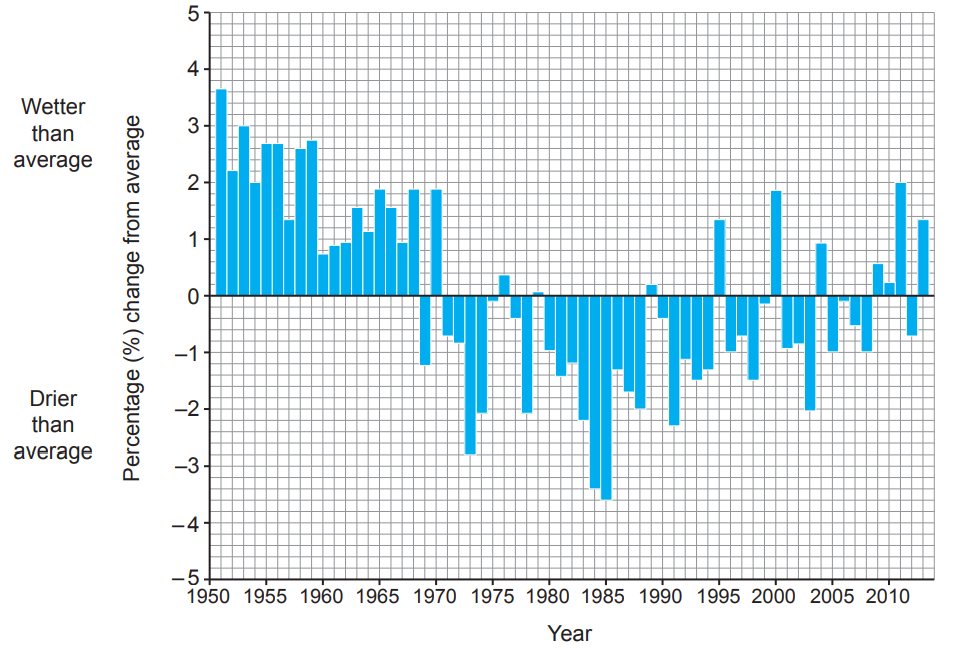
Use Figure 3.2 to decide if each of the statements below is true or false.
Statement | True Tick (√) | False Tick (√) |
1950–1959 was the wettest 10-year period | ||
1970–1979 was the driest 10-year period | ||
In 2013, rainfall was higher than average | ||
Between 2000 and 2009 rainfall was mostly lower than average |
Was this exam question helpful?
Desertification is caused by both physical and human actions.
Complete the sentences below by adding the correct words from the box.
moisture deposition nutrient evaporated erosion intercepted management condensed salt |
Increases in temperature mean more rainfall is ................................... which means that less ........................................... is retained in the soil. If trees are cut down, then the .............................................cycle is broken and the roots no longer hold the soil together. This increases the process of ............................................................. .
Was this exam question helpful?
Explain why overgrazing can lead to desertification.
Was this exam question helpful?
Drip irrigation is used in areas vulnerable to desertification.
Describe how drip irrigation works.
Was this exam question helpful?
Study Figure 3.2 below, which shows how much of each continent is under threat from desertification.
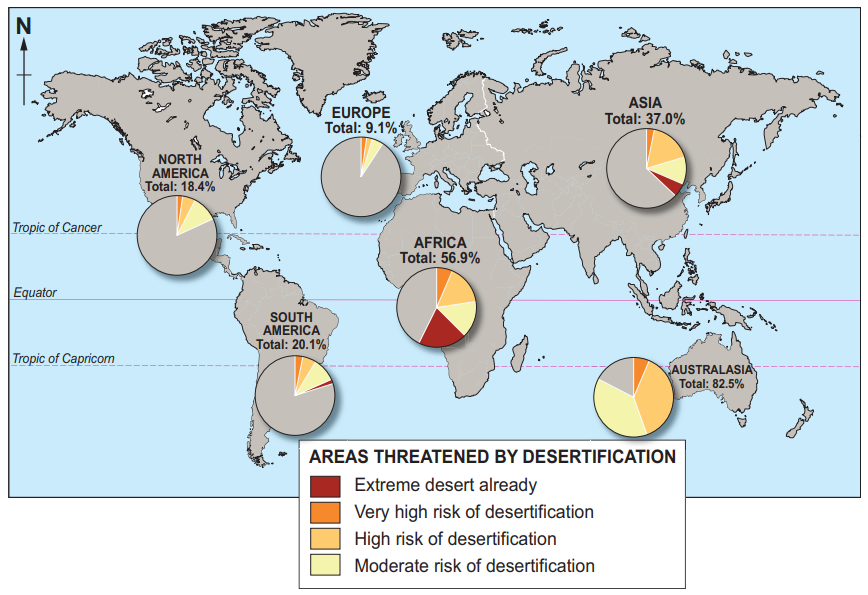
Complete the sentences below using the information from Figure 3.2.
The continent which already has the largest area of extreme desert is ..........................................................
The continent with the largest percentage area at high risk of desertification is ..........................................................
Suggest two other appropriate techniques which could be used to represent this data.
Was this exam question helpful?
Explain why human activity can increase the process of desertification.
Was this exam question helpful?
Study the photographs and map below, which show some strategies to reduce desertification.
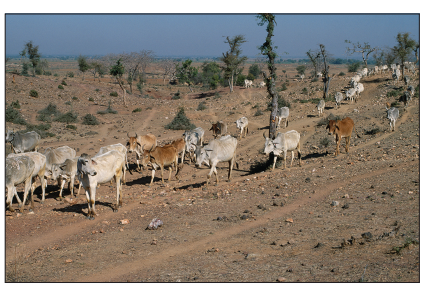
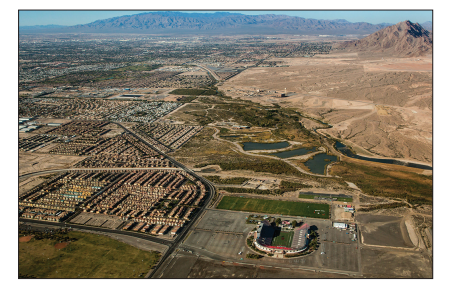
Evaluate how successful strategies like these could be in reducing the spread of desertification.
Was this exam question helpful?
Migrants from the northern region of Kenya suggest that desertification was an important reason for leaving. What is desertification?
Was this exam question helpful?
Other parts of the world also suffer from desertification. Describe the global distribution of regions at risk of desertification.
Was this exam question helpful?