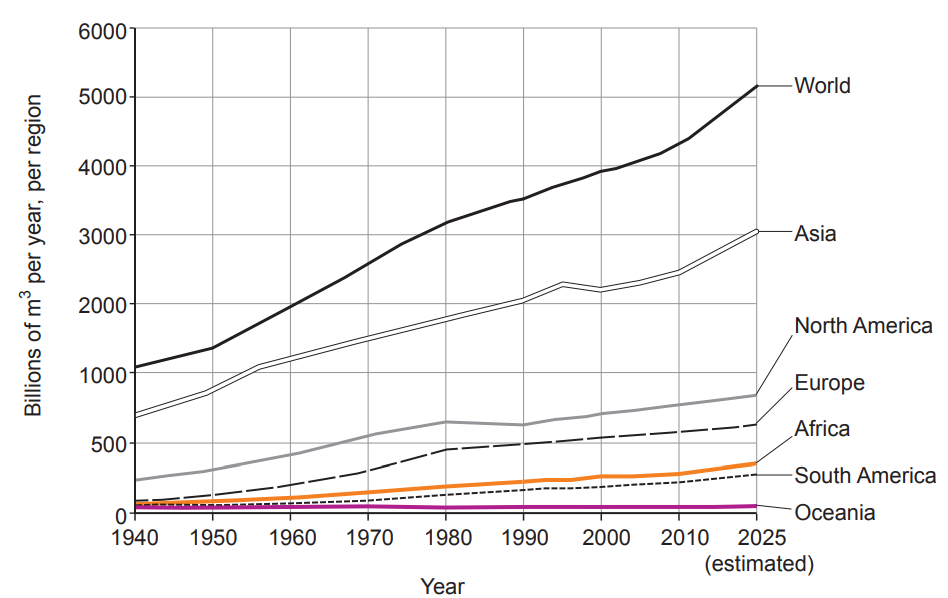
Water Resources & Management (WJEC Eduqas GCSE Geography B): Exam Questions

Exam code: C112

2 hours22 questions
1a
4 marks

Study Figure 3.2.

Line graph showing water usage trends from 1940 to 2025 by region. World and Asia lines increase steeply; others rise gradually. Oceania stays low.
Figure 3.2: Global Water Consumption 1940–2025 (by region, in billions of m3 per year)

Circle the correct answer in each of the following statements.

The region with the lowest water consumption in 2010 was ( Africa / South America / Oceania ).

In 1990, water consumption in Asia was ( 1000 / 2000 / 3000 ) billionm3 per year.

Between 1990 and 2000 total world water consumption increased by approximately ( 500 / 1000 / 1500 ) billion m3 .

The greatest increase in water consumption between 2010 and 2025 will be in the continent of ( North America / Europe / Asia ).

1b
1 mark

Give one reason why a line graph is the most appropriate technique to show the information in Figure 3.2.

2
4 marks

Explain why population growth leads to increased demand for water.

3
8 marks

Study Figure 3.3

Infographic on Itaipu Dam featuring location map, facts about energy supply, environmental impact, biosphere reserve info, and aerial dam views.
Figure 3.3: The Itaipu Dam and Hydroelectric (HEP) Scheme on the border of Brazil, Paraguay and Argentina, in South America.

Should a project like the Itaipu Scheme be used as the best option for water management in other countries?

Justify your views.

You may also use examples you have studied to support your answer.

4a
1 mark

Over-abstraction of water is an issue in these four countries. State what is meant by over-abstraction.

4b
6 marks

Explain why over-abstraction of water causes problems.

5a
2 marks

Study Figure 3.1.

Graph showing life expectancy versus access to safe water for various countries. Higher access correlates with increased life expectancy.
Figure 3.1 – Scatter graph showing life expectancy and people’s access to safe water for some countries

Draw the line of best fit onto Figure 3.1 to show the relationship between the two variables.

5b
1 mark

Give one conclusion about the relationship between life expectancy and access to safe water shown in Figure 3.1.

5c
4 marks

Explain why a lack of water security has a negative economic impact.

6
2 marks

Study Figure 3.2

Map showing Lake Mead and Hoover Dam in the southwestern USA, highlighting state and country boundaries, with inset map of Lake Mead's location in the USA.
Figure 3.2 – Location of Lake Mead in the USA

Describe the location of Lake Mead in the USA.

7
3 marks

Study Figure 3.3

Graph showing a decreasing trend in water levels from 1225 feet in 2000 to around 1075 feet in 2020, with fluctuations throughout the years.
Figure 3.3 – Changes in the water level of Lake Mead at the Hoover Dam from 2000 to 2021

Describe the changes in water level at the Hoover Dam from 2000 to 2021.

You should use figures in your answer.

8
1 mark

The USA Government decided to reduce water supplies from the Colorado River to parts of the USA and Mexico from 2022.

Study Figure 3.4.

Sign warns of low water at Echo Bay. Fact box details Colorado River drought effects. Images show Hoover Dam water levels in 1998 and 2013.
Figure 3.4

How far do you agree that reducing water supply taken from the Colorado River is the most effective solution to manage this water crisis?

You should refer to Figure 3.2, Figure 3.3 and Figure 3.4 in your answer.

Map showing southwestern USA, highlighting Lake Mead, Hoover Dam, Las Vegas, Los Angeles, San Francisco, state and country boundaries, and the Colorado River.
Figure 3.2-location-of-lake-mead-in-the-usa
Graph showing declining water levels in feet from 2000 to 2022, with fluctuations and a notable drop around 2020.
Figure 3.3 – Changes in the water level of Lake Mead at the Hoover Dam from 2000 to 2021
9
2 marks

Join the terms ‘over-abstraction’ and ‘water footprint’ with a straight line to the correct definition.

Match terms: "Over-abstraction" with "Taking too much water from an aquifer" and "Water footprint" with "The water used by a household" from the image list.
10
4 marks

Water is a vital human resource.

Study Figure 4.1 below.

World map showing water footprint per person by country, using colour-coded categories from 600 to over 2500 m³ per year; includes a key and latitude lines.
Figure 4.1 – Global water footprint

Use the information in Figure 4.1. Tick (√) the four correct statements about the global water footprint in the table below.

  • South America has a higher water footprint than North America.

  • there are no countries in Australasia which are below the global average water footprint.

  • countries in Southern Africa have a lower water footprint than those in Northern Africa.

  • North America has a higher water footprint than South America.

  • there are no countries in Europe with a below global average water footprint

  • countries with the lowest water footprint are only found south of the Equator.

  • there are no countries with the highest water footprint south of the Tropic of Capricorn.

11
4 marks

Explain why there is an increasing demand for water in some places.

12a
2 marks

Study Figure 4.2.

Item

Amount of water needed to produce it

1litre orange juice

1020litres

1litre milk

1000litres

1kg rice

2500litres

1kg sugar

1800litres

1kg butter

940litres

1dozen eggs

2400litres

Suggest two appropriate techniques from the table below which could be used to show the information in Figure 4.2.

  • Pie chart

  • Triangular graph

  • Bar graph

  • Pictogram

  • Radial graph

12b
2 marks

Give two reasons why a line graph would not be an appropriate technique to show this information.

13
4 marks

Describe one advantage and one disadvantage of transferring water between two countries.

14a
2 marks

Study Figure 3.3 below.

Bar chart showing water use by sector in 2020 and 2030. Domestic increases from 10% to 13%, industry rises from 20% to 33%, agriculture decreases from 70% to 54%.
Figure 3.3 – Graph to show predicted changes in the global use of water between 2020 and 2030.

Use the information in the table to complete the graph for 2030.

14b
4 marks

Give two reasons why economic growth leads to an increased demand for water

15
8 marks

Study the resources in Figure 3.4 below. The Mekong river crosses six countries.

Map of Mekong River with existing, under construction, and planned dams, plus photos of a dam in Laos and fishing in Vietnam. Scale in kilometres.
Figure 3.4 – Water Management on the Mekong River.

Evaluate the impacts of water management across national boundaries.

You may use the resources above and/or examples you have studied to support your answer.

16
2 marks

Study Figure 1.

World map highlighting San Diego, Valencia, Cape Town, and Perth. Shows the Equator, Tropic of Cancer, and Tropic of Capricorn lines.
Figure 1- The location of 4 cities with a Mediterranean climate.

Identify two features that all four locations have in common. Use map evidence only.

17
6 marks

With increasing populations, growing cities face a number of issues related to water shortages.

In the table below, identify if the issue is environmental, economic or social by writing EN or EC or SO in the second column.

EN – environmental EC – economic SO – social

Issues related to water shortages

EN or EC or SO

If we abstract (take) too much water from underground stores (aquifers), surface rivers can dry up and ecosystems suffer.

The cost of providing fresh water can be very high, so water bills for industry are constantly rising, which means lower profits for companies.

Neighbourhood arguments break out when some households ignore appeals to save water and continue to water their gardens and wash their cars.

Some farmers have abandoned the idea of growing highly profitable crops that need lots of water. These farmers earn less money.

The look of the city is changing. There is less greenery. Grassed areas and borders planted with flowers are being removed in an attempt to save water.

Turning sea water into fresh water (desalination) can damage coastal ecosystems reducing biodiversity

18
2 marks

In recent years the water authorities in cities like San Diego and Perth have warned people that the situation is serious.

Illustration of a worried woman with brown hair in a yellow circle, discussing water demand, supply issues, and frequent droughts in a speech bubble.

The comment refers to sustainability and drought. Tick (√) the two boxes that best gives an accurate meaning for each term.

Sustainable means using a resource:

Tick (√) the correct box

when it is needed, without worrying about the future.

carefully, so that the cost remains low for all to afford.

wisely, so that it is not depleted or permanently damaged

Drought means:

Tick (√) the correct box

a time when people use up all of the available water.

a period of short, heavy rainfall.

a prolonged period when expected rains do not fall.

19
4 marks

Transferring water between countries can be used to solve water shortages.

Describe two challenges of managing water in this way.

20
2 marks

Strategy 1 – Using underground water stores (aquifers).

Image showing a water pumping station near Perth and a diagram illustrating how aquifers work. Includes pros and cons of aquifer water usage.
Strategy 1: Using underground water stores (aquifers)

Study the above information.

If the wells used by farmers dry up, their profits will fall. Suggest one reason why.

21a
1 mark

Strategy 3 – Persuading people to use less water.

Infographic on water conservation efforts in Perth and San Diego, highlighting methods like grey water use, fines, and water-saving appliances with pros and cons.
Strategy 3: Persuade people to use less water

Study the above information.

The table below shows how people living in different cities feel about three strategies used to overcome water shortages.

The percentage (%) of people who believe that .................................

Cities

Using groundwater is the best option

Using desalination is the best option

Passing strict new laws is the best option

Perth

50%

..........%

10%

San Diego

40%

45%

10%

Cape Town

85%

10%

5%

Complete the table by adding the % figure for desalination use in Perth.

21b
2 marks

What conclusions can you reach from the data provided in the table?

1st conclusion: ..........................................................................................

2nd conclusion: .......................................................................................

21c
2 marks

Suggest one reason why the introduction of strict new laws can be an unpopular way to reduce water use.

22
2 marks

Strategy 4 – Stopping the future growth of ‘thirsty’ industries.

Fact box and images about 'thirsty' industries using water; effects include increased water supplies, reduced demand for desalination, and potential unemployment.
Strategy 4: Stop the future growth of ‘thirsty’ Industries

Study the above information.

Growing crops, such as almonds and avocados, and mining for rocks, such as bauxite, require a huge quantity of water. These processes have a large water footprint.

What is a water footprint?