Moving Averages (Edexcel GCSE Statistics): Revision Note
Exam code: 1ST0

Moving Averages
What are moving averages?
A moving average is the average of a number of successive observations
This makes it easier to spot trends in data that varies cyclically or seasonally
The number of data points included in each average must cover one complete cycle
Usually this will mean one complete year
A four-point moving average is the most common moving average
e.g. for a year divided into four quarters or into four seasons
To calculate moving averages
e.g. for a four-point moving average with 8 data points
the first moving average is the mean of the first four data points
the second moving average is the mean of the 2nd through 5th data points
the third moving average is the mean of the 3rd through 6th data points
the fourth moving average is the mean of the 4th through 7th data points
the fifth (and last) moving average is the mean of the 5th through 8th data points
Note that the group of data points for each moving average overlaps the group before and after it
Stop when you can no longer get a ‘full group’ for the next average
e.g. four points for a four-point moving average
How do I plot moving averages on a time series graph?
It is useful to plot moving averages onto a time series graph
This makes it easier to draw accurate trend lines
Each moving average should be plotted at the midpoint of the time intervals it covers
e.g. for a four-point moving average
the average for the first 4 points will be plotted halfway between the 2nd and 3rd points
the average for the 2nd through 5th points will be plotted halfway between the 3rd and 4th points
etc.
You should not join up the points for moving averages
Examiner Tips and Tricks
Remember not to join up the moving average points on a time series graph
This is different from the data points, which are joined up
Worked Example
The following table records the number of visitors to Wayne’s World of Widgets for 2021, 2022 and the first two quarters of 2023:
Year | 2021 | 2022 | 2023 | |||||||
Quarter | 1 | 2 | 3 | 4 | 1 | 2 | 3 | 4 | 1 | 2 |
Visitors (thousands) | 6.2 | 8.5 | 8.8 | 7.6 | 6.2 | 8.9 | 9.6 | 7.9 | 6.8 | 9.5 |
This data is also represented on the following time series graph:
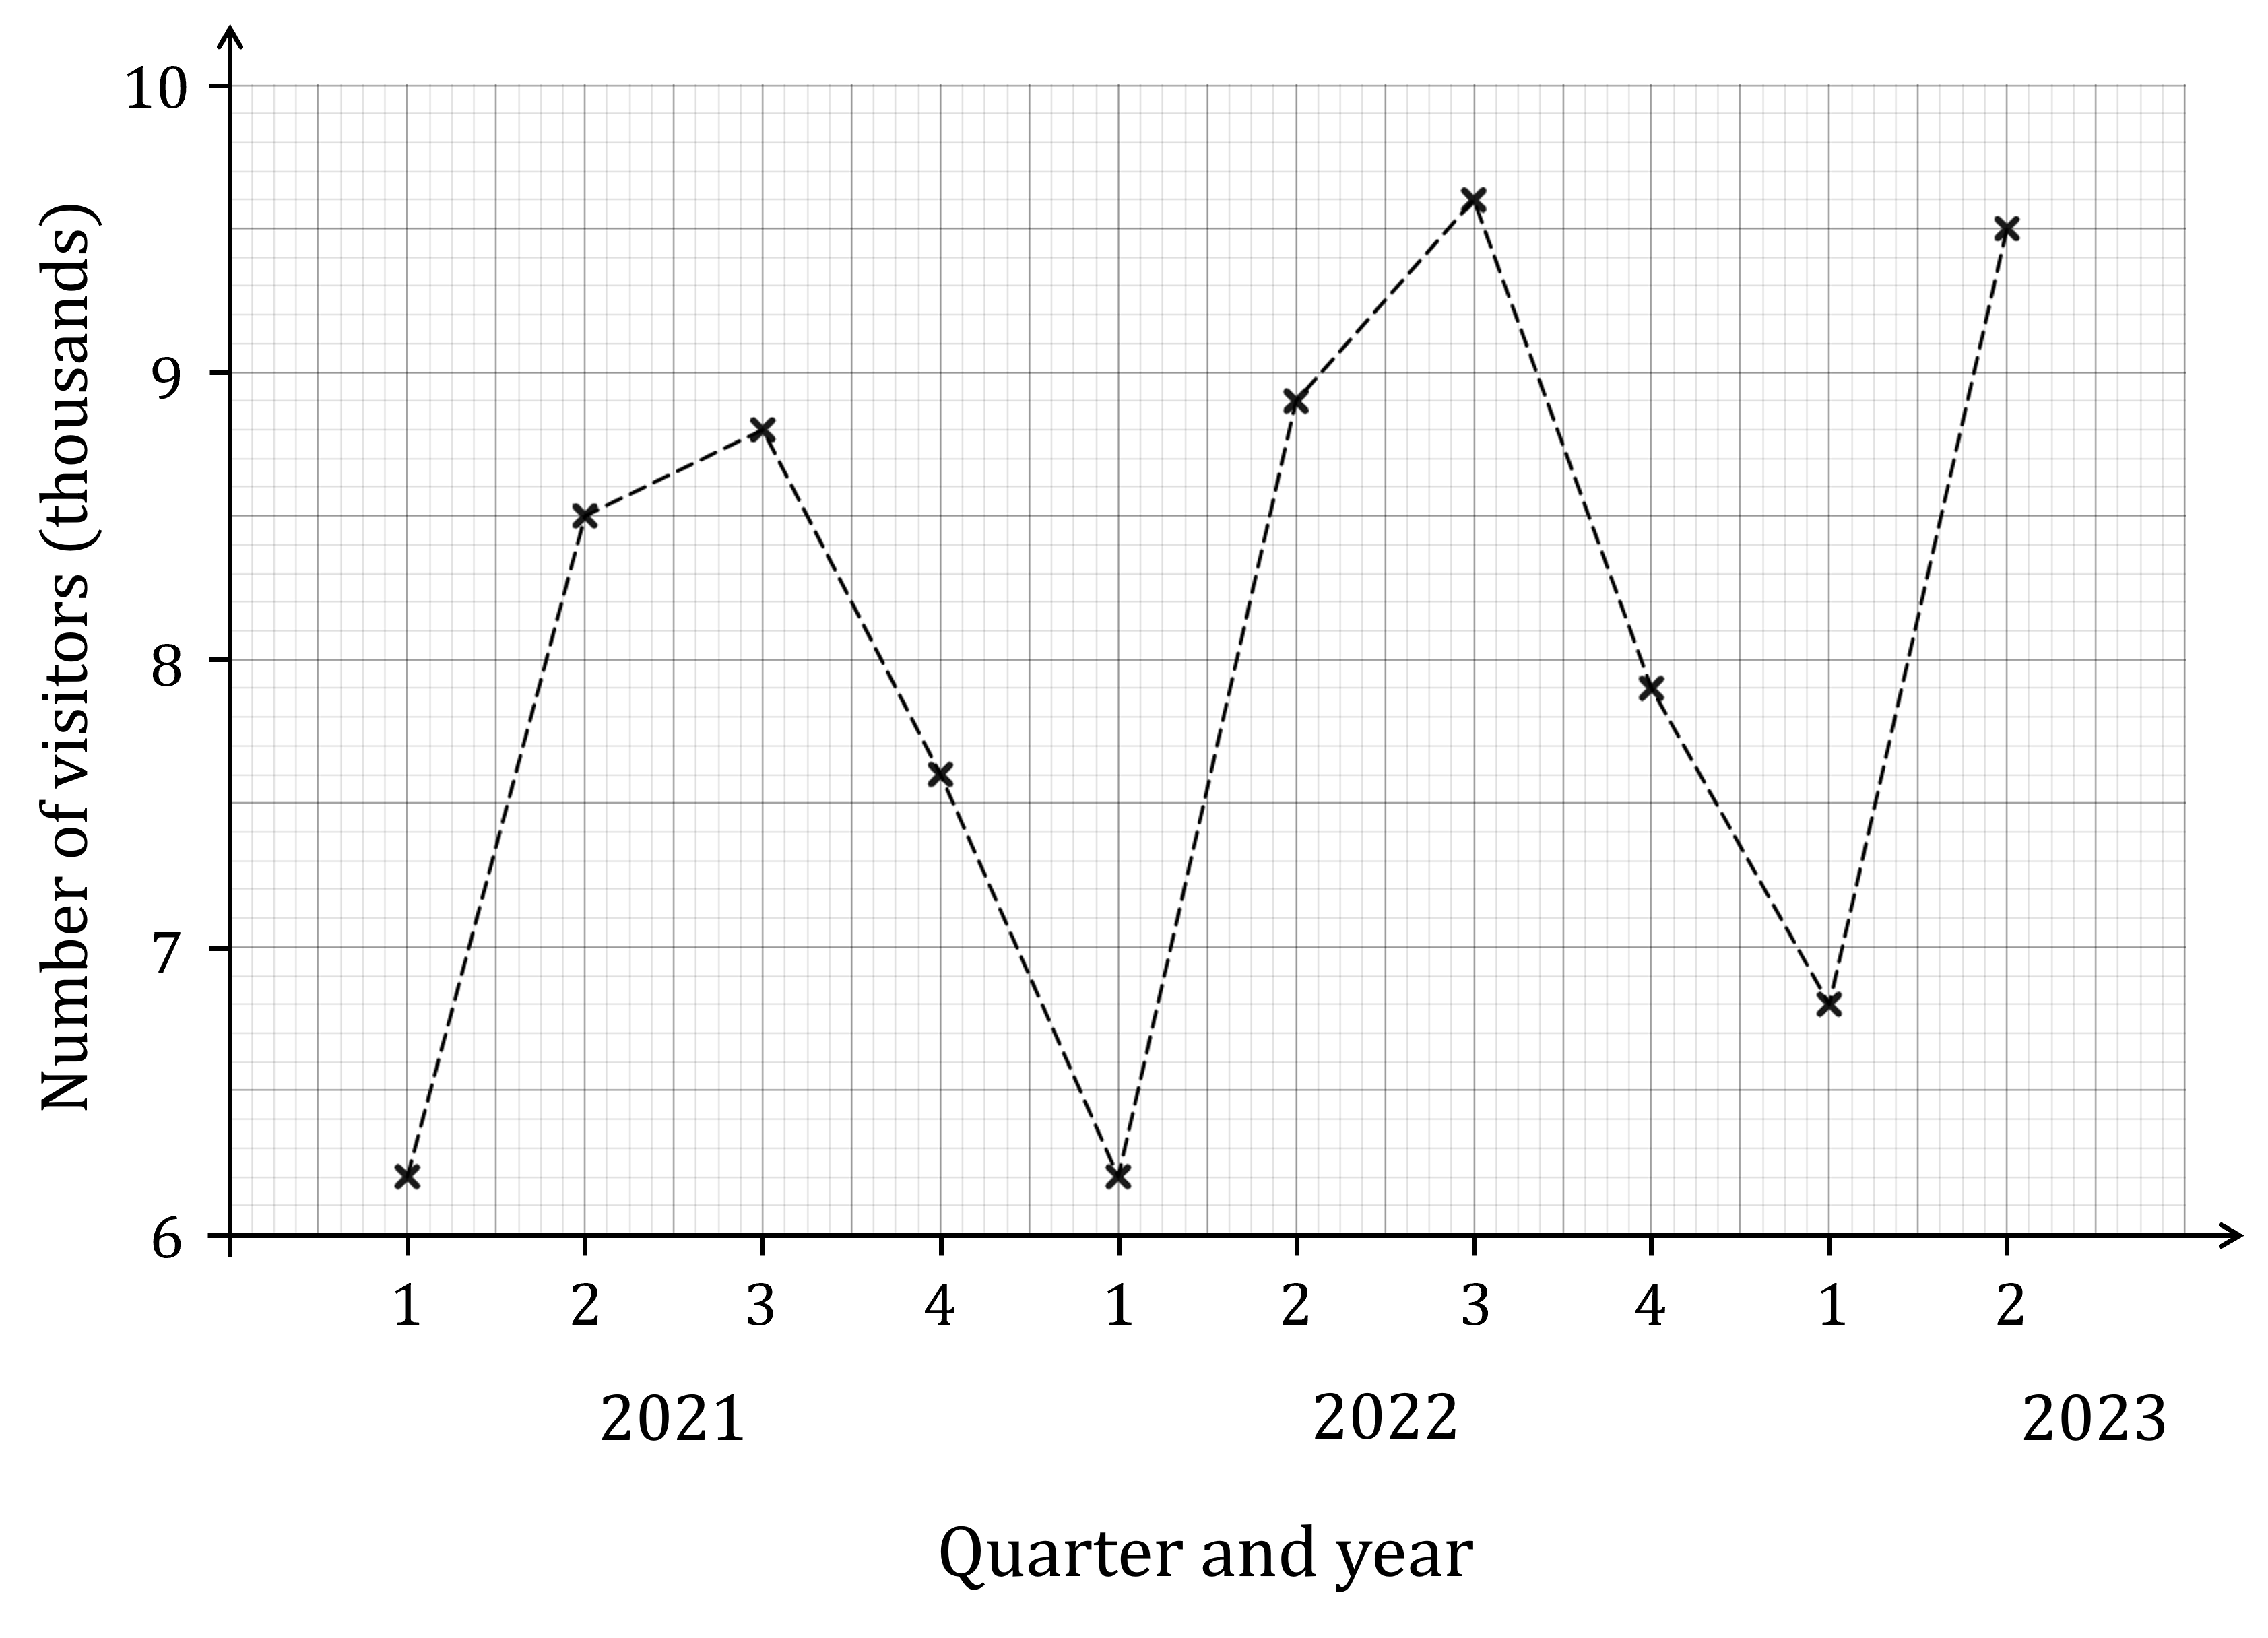
Calculate the four-point moving averages for this data and plot them on the time-series graph.
The first moving average will be the mean of the first 4 data points (i.e. the 4 quarters of 2021)
Remember, to find the mean add the values together and divide by the number of values
![]()
The next moving average will be the mean of the next group of 4 data points (i.e. quarters 2, 3 and 4 of 2021 and quarter 1 of 2022)
![]()
Continue this process to find all 7 moving averages
![]()
![]()
![]()
![]()
![]()
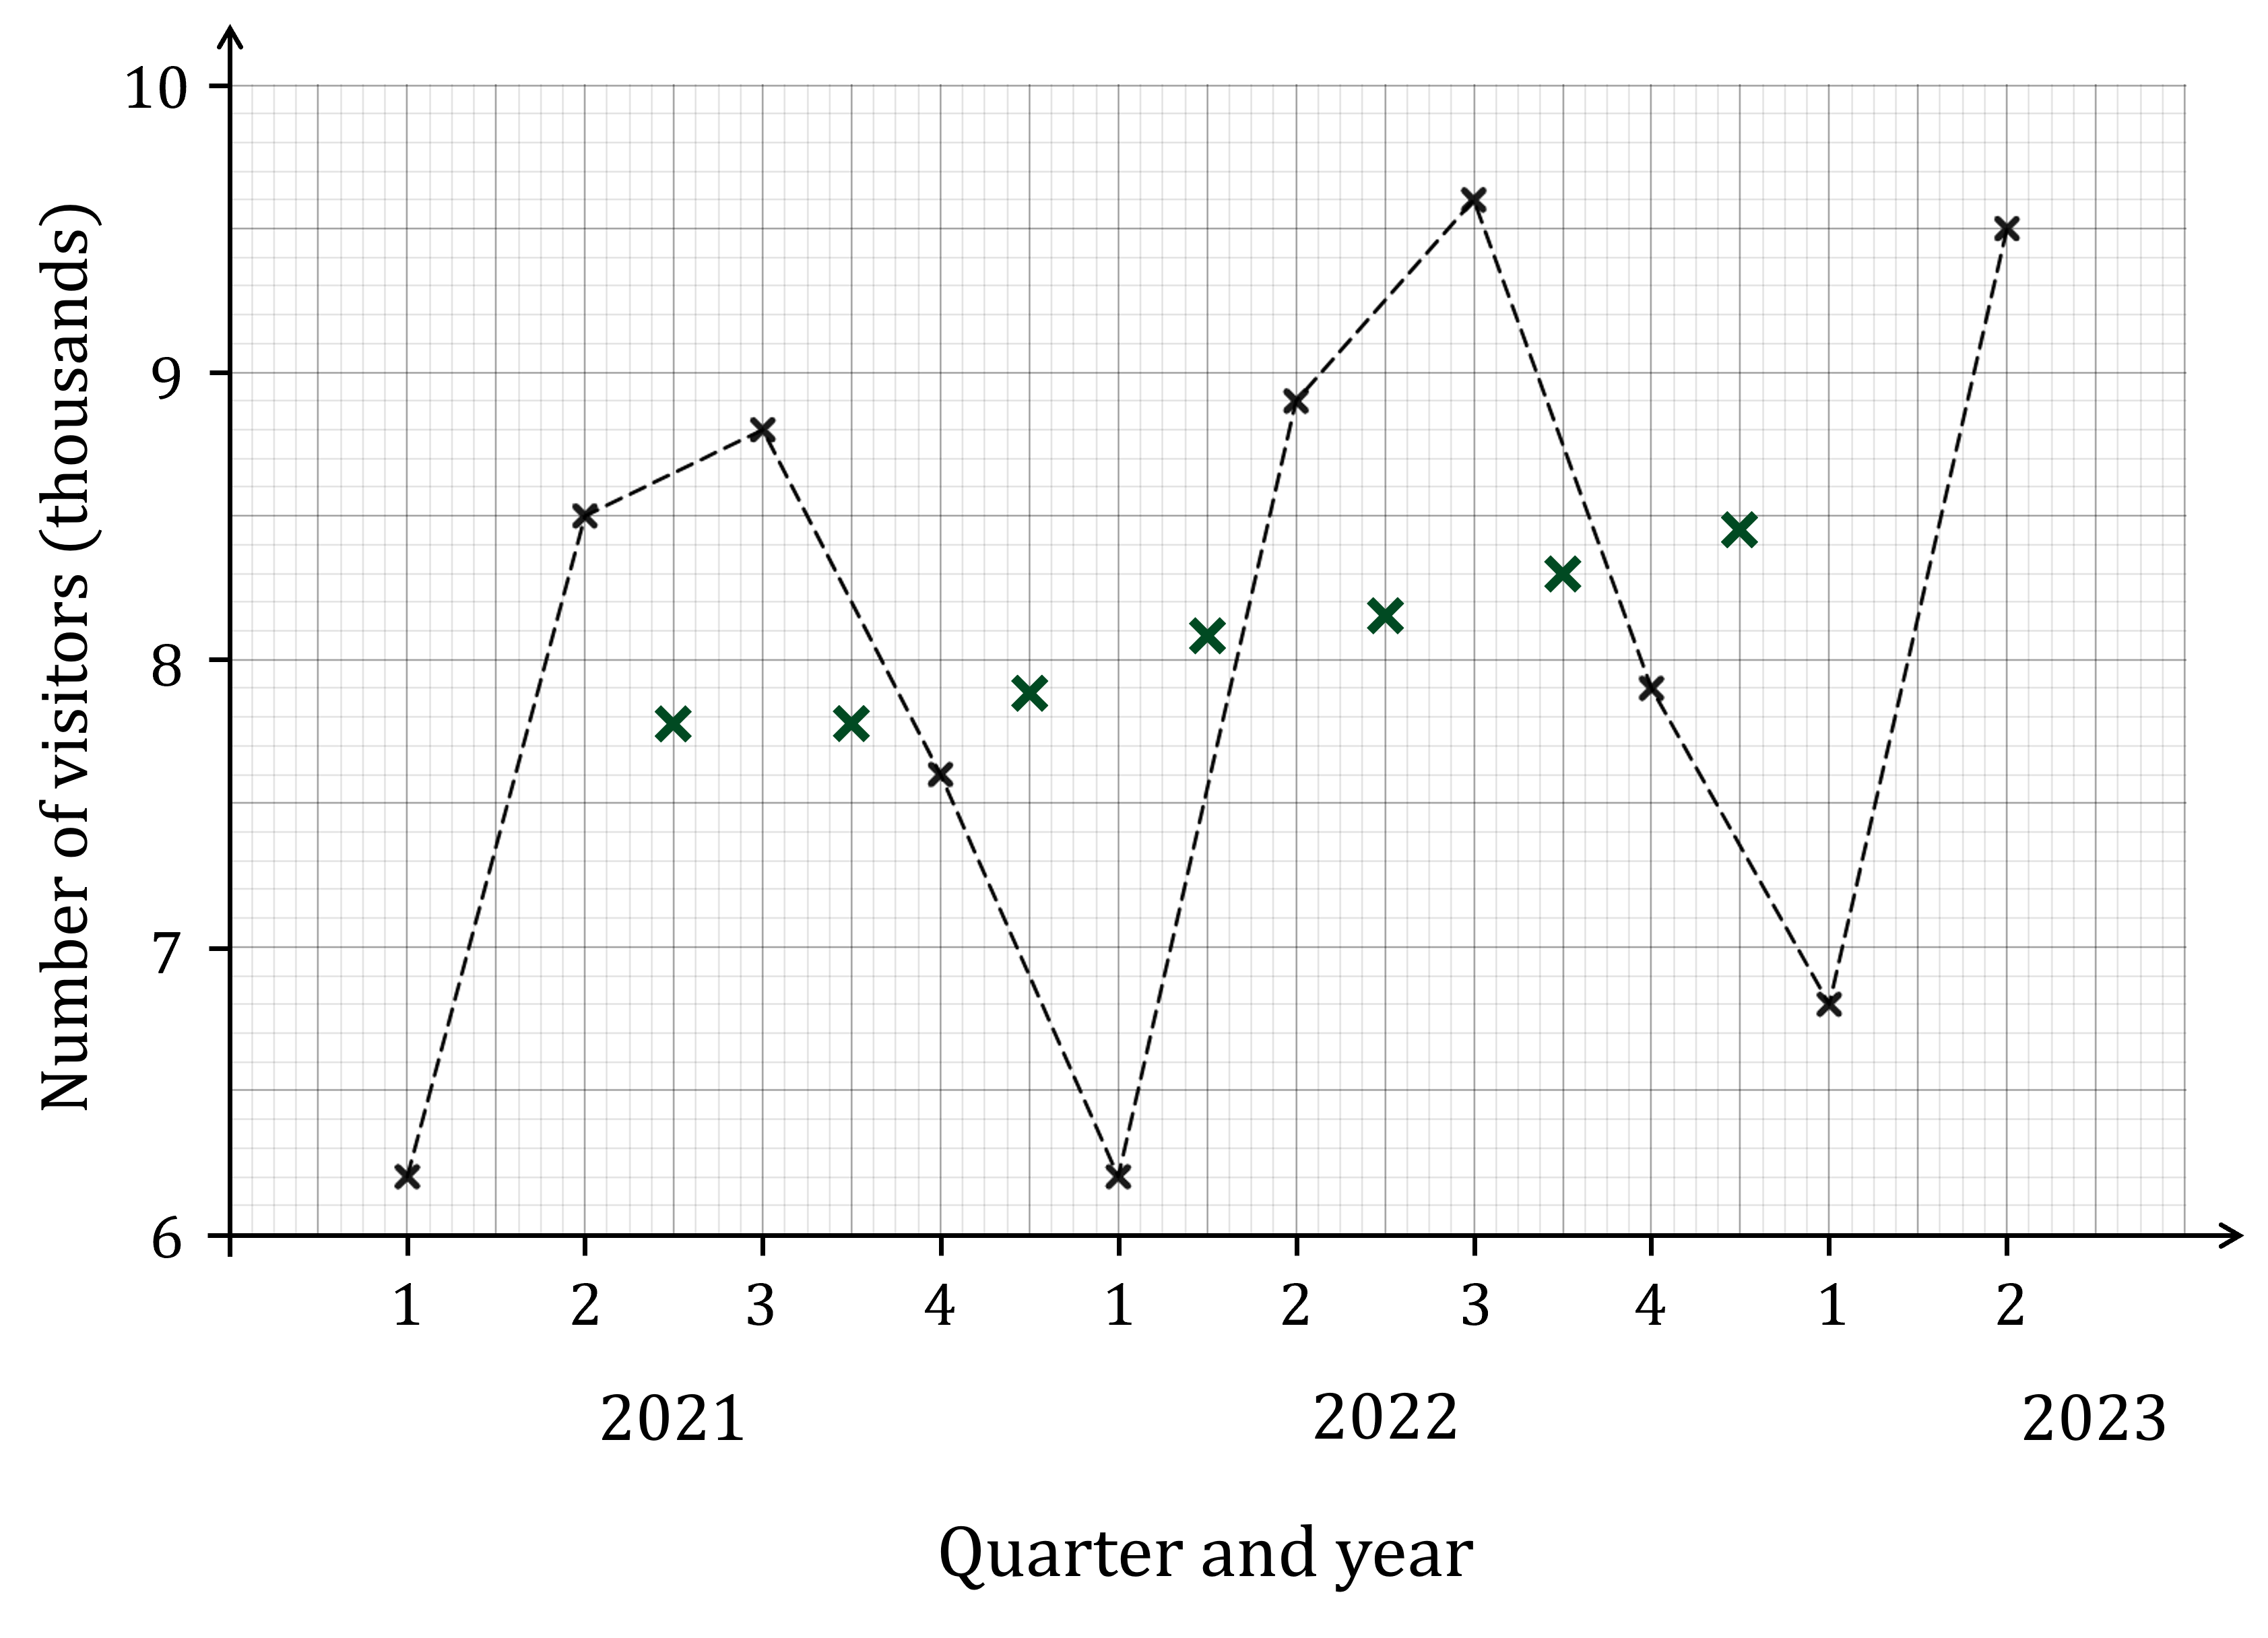
Now plot these on the time series graph
Remember, these need to be plotted at the midpoint of the time intervals each one covers
So the first point will be halfway between quarters 2 and 3 of 2021
The second point will be halfway between quarters 3 and 4 of 2021
And so on
Also remember not to join these moving average points up!

Unlock more, it's free!
Join the 100,000+ Students that ❤️ Save My Exams
the (exam) results speak for themselves:

Was this revision note helpful?
