Measures of Dispersion (Edexcel GCSE Statistics: Foundation): Exam Questions

Exam code: 1ST0

46 mins6 questions
1a
2 marks

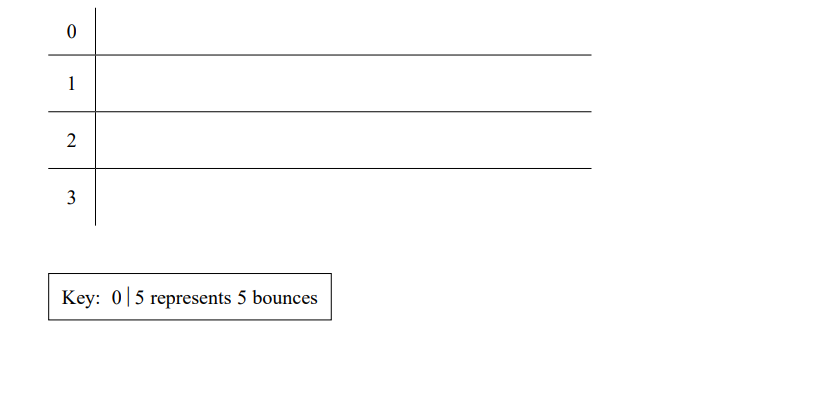
27 adults were each asked to count the number of times they could bounce a ball on a bat.

Here are the results.

5

8

13

5

7

23

30

6

21

24

23

22

13

9

12

6

12

34

22

20

35

22

12

16

24

13

12

Complete the stem and leaf diagram for this information.

Graph with horizontal lines numbered 0-3 on the left. Key box reads: "0 | 5 represents 5 bounces" at the bottom left.
1b
Sme Calculator
2 marks

Work out the interquartile range of the results.

1c
3 marks

The median of the results for 27 children is 9.

The interquartile range of the results for these children is 6.

Alex thinks these results show that adults are better than children at bouncing a ball on a bat.

Do you agree with Alex?
You must give reasons for your answer.

2a
1 mark

A basketball team played 9 matches at the start of a season.

The total number of points they scored in each match is listed below.

80

64

87

64

42

81

89

138

68

Here are some words used to describe data.

grouped    discrete    categorical    continuous

Select a word from the list to complete the sentence.

The total number of points scored in a match is an example of ___________ data.

2b
2 marks

Work out the median score for these 9 matches.

2c
1 mark

Give one advantage of using the median to summarise this data.

2d
Sme Calculator
2 marks

Work out the range of points for these 9 matches.

2e
4 marks

The median and range for the final 9 matches of the season are shown in the table below.

Median

Range

90

25

Use your answers to part (b) and part (d) to compare the performance of the basketball team in the first 9 matches with the performance in the final 9 matches.

Give two comparisons and interpret both in context.

3a
1 mark

Tachi collects data on the heights, in metres, of a sample of Egyptian pyramids.

Here is her data.

136.4

101.1

104

62.6

138.8

65.5

93.5

(Source: www.rankred.com (opens in a new tab))

Tachi picks one of these pyramids at random.

Find the probability that this pyramid will have a height of more than 100 m.

3b
Sme Calculator
4 marks

The mean height of a sample of Mexican pyramids is 53.5 m.

Tachi says, "On average these Egyptian pyramids are twice as high as the Mexican pyramids."

Is Tachi correct?
You must show working to support your answer.

3c
1 mark

The range of heights for the Mexican pyramids is 45m.
The lowest height of the Mexican pyramids is 30m.

Work out the greatest height of the Mexican pyramids.

............................. m

4a
1 mark

David asked 15 of his friends about the number of pets they each have. Here is the data he collected.

0   0   0   0   0   1   1   2   2   2   4   4   4   4   8

Choose the word in the list below that describes this type of data.

  • continuous

  • qualitative

  • discrete

  • grouped

4b
1 mark

Write down the modal number of pets.

4c
1 mark

Find the median number of pets.

4d
1 mark

State which average, the mode or the median, best represents these data. Give a reason for your answer.

4e
1 mark

Find the interquartile range of the number of pets.

4f
4 marks

Wanda asked some of her friends about the number of pets they each have.

The table below is a summary of the data she collected.

Lower quartile

Median

Upper quartile

1

3

6

Compare the distribution of the numbers of pets for David with the distribution of the numbers of pets for Wanda.

Give two comparisons and interpret each of your comparisons.

4g
1 mark

Wanda recorded the highest number of pets as 15

She says that this must be an outlier and concludes that it should be removed from her data.

(i) Give one reason why Wanda’s conclusion may be appropriate.

[1]

(ii) Give one reason why Wanda’s conclusion may not be appropriate.

[1]

5a
2 marks

Sam used the internet to collect the times, in minutes, it took for 50 cyclists to compete in a hill climb competition. He used a group frequency table to record the results he collected.

(i) Give one advantage of using grouped data rather than raw data.

[1]

(ii) Give one disadvantage of using grouped data rather than raw data.

[1]

5b
1 mark

Sam used this grouped frequency table to show the results for the hill climb.

Time (t minutes)

Frequency

11 less or equal than t less than 12

2

12 less or equal than t less than 13

25

13 less or equal than t less than 14

15

14 less or equal than t less than 15

4

15 less or equal than t less than 16

1

16 less or equal than t less than 17

1

17 less or equal than t less than 18

1

(Source: cyclinguphill.com (opens in a new tab))

Before Sam collected the data he did not know what the longest time would be. The longest time in the hill climb was 28.3 minutes.

Explain why this table cannot be used to show the data for all 50 riders.

5c
1 mark

Sam drew this frequency polygon for the hill climb results.

Line graph showing frequency versus time taken in minutes, peaking at 24 frequency for 13 minutes, then declining to 2 frequency by 17 minutes.

Sam decided not to include the value of 28.3 minutes on his frequency polygon.

Suggest a reason why Sam’s decision might be appropriate.

5d
2 marks

(i) Describe the skew of the distribution

[1]

(ii) Interpret the skew of the distribution in context.

[1]

6a
1 mark

The cumulative frequency step polygon shows information about the number of goals scored in each of 28 matches played by the German women’s national football team.

Graph showing cumulative frequency of goals scored, ranging from 0 to 12 on the x-axis and 0 to 28 on the y-axis, with a step-like line.

(Source: www.worldfootball.net/teams/deutschland‑frauen‑team/)

Give a reason why a cumulative frequency step polygon is used to represent this information rather than a cumulative frequency curve.

6b
1 mark

Find the mode of the number of goals scored.

6c
3 marks

Find the number of these matches where

(i) exactly 6 goals were scored,

[1]

(ii) more than 6 goals were scored.

[2]

6d
1 mark

In 24 matches fewer than n goals were scored.

Find the value of n

6e
1 mark

Klara tries to calculate the interquartile range of the number of goals scored.

She gets an answer of 14

Explain how you know that her answer is incorrect.