The table and the time series graph give some information about the numbers of visits abroad (in millions) made by UK residents for the years 2013 to 2015.
Year | Quarter | Number of visits (millions) | 4-point moving average (millions) |
|---|---|---|---|
2013 | 1 | 10.2 | |
2 | 15.9 | ||
3 | 20.1 | 14.45 | |
4 | 11.6 | 14.55 | |
2014 | 1 | 10.6 | 14.75 |
2 | 16.7 | 14.85 | |
3 | 20.5 | 15.00 | |
4 | 12.2 | 15.225 | |
2015 | 1 | 11.5 | 15.55 |
2 | 18.0 | 16.00 | |
3 | 22.3 | ||
4 | 13.4 |
(Source: Office for National Statistics)
The last 4-point moving average is missing from the table and from the time series graph.
(i) Calculate this 4-point moving average. Write your answer in the table.
(ii) Plot this 4-point moving average on the time series graph.
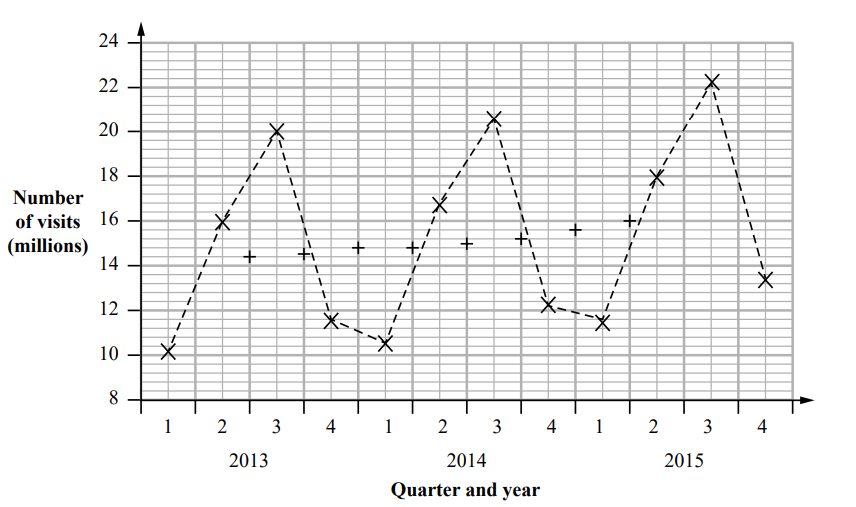
For which quarter was the number of visits abroad by UK residents the greatest?
Describe and interpret the trend in the number of visits abroad made by UK residents for the years 2013 to 2015
Compare and interpret the seasonal variation for each quarter in the number of visits abroad made by UK residents for the years 2013 to 2015
Was this exam question helpful?