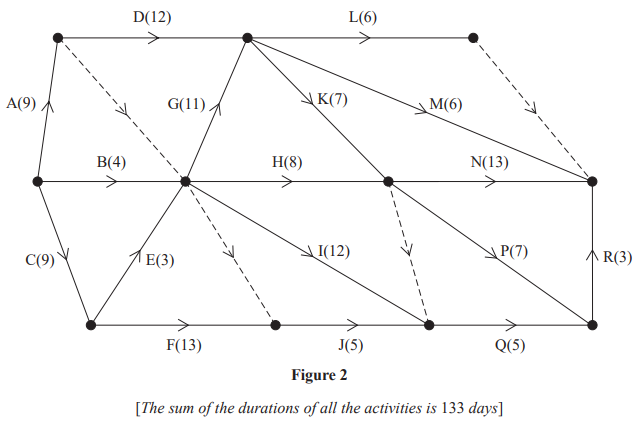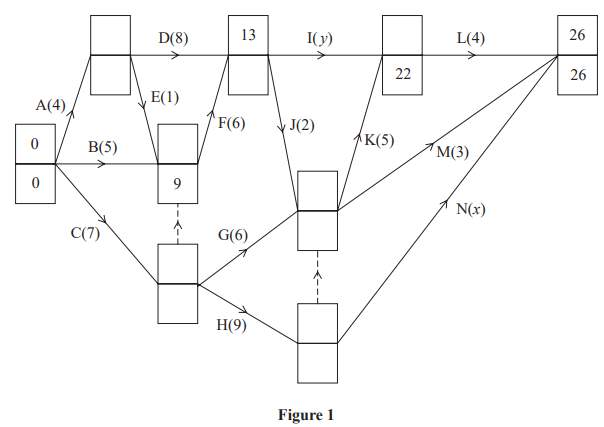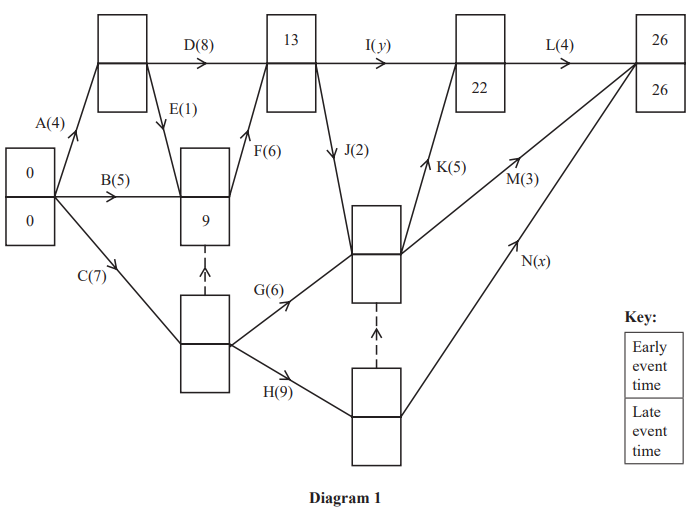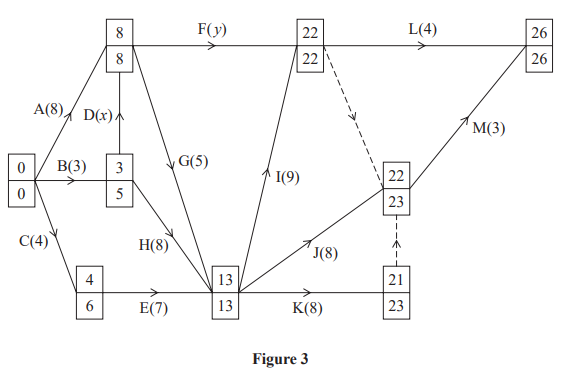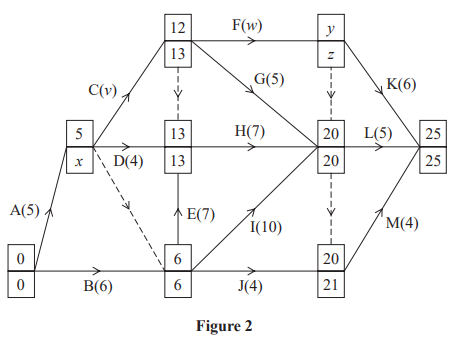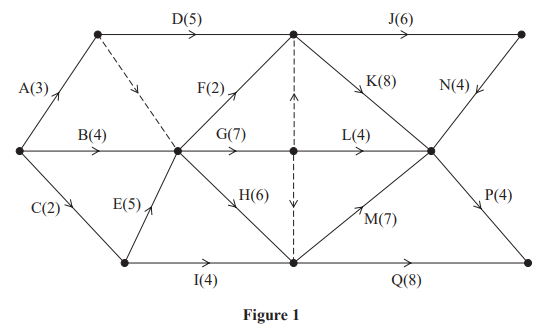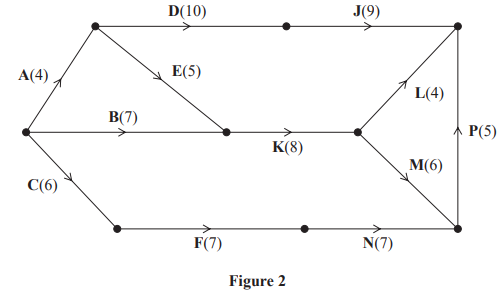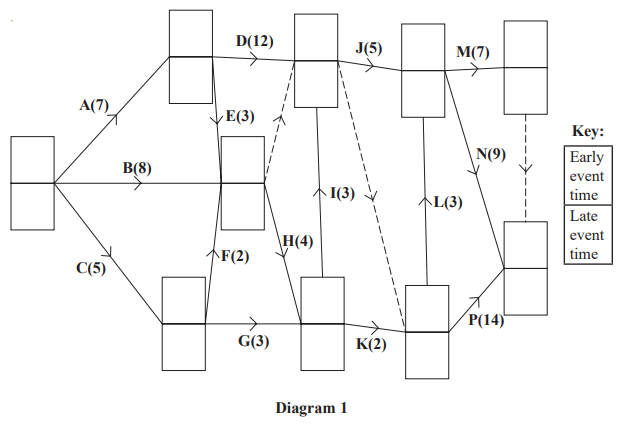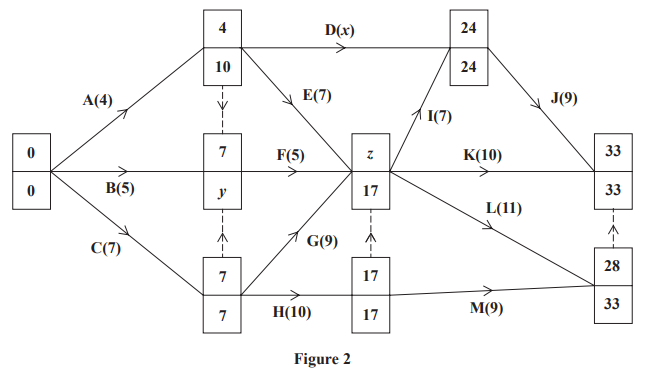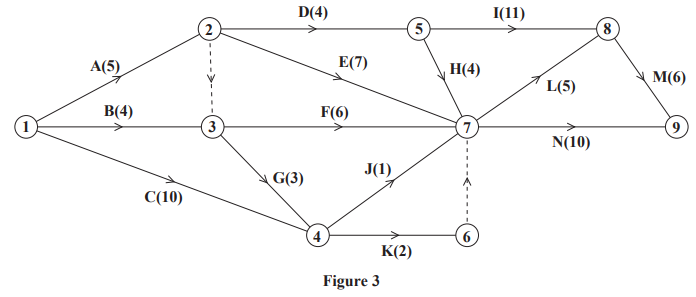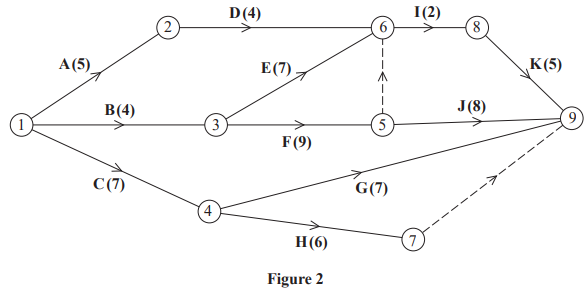
A project is modelled by the activity network shown in Figure 2. The activities are represented by the arcs. The number in brackets on each arc gives the time required, in hours, to complete the activity. The numbers in circles are the event numbers. Each activity requires one worker.
Explain the significance of the dummy activity
(i) from event 5 to event 6
(ii) from event 7 to event 9
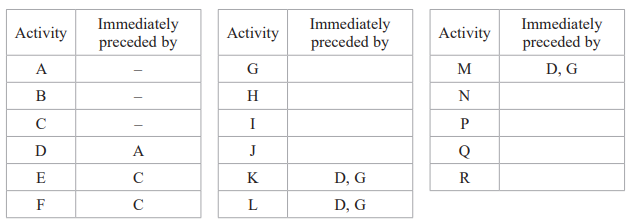
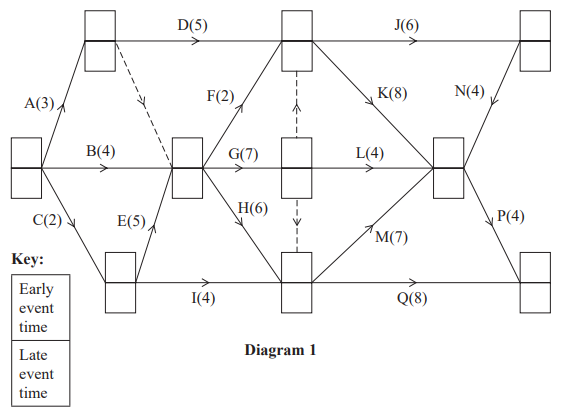
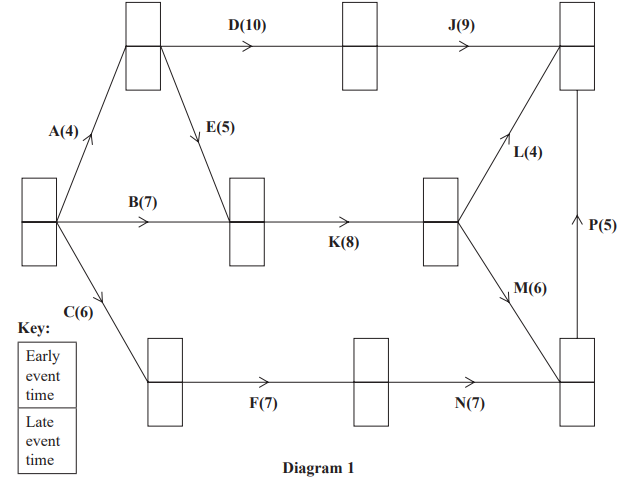
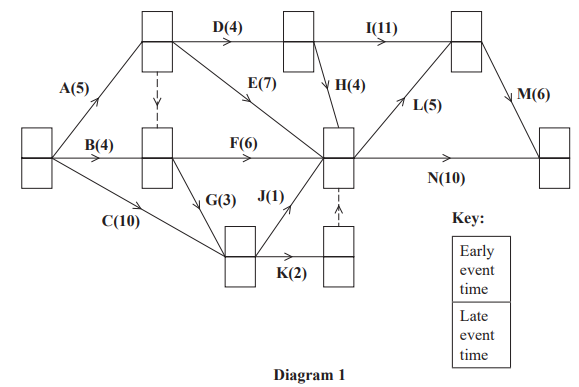
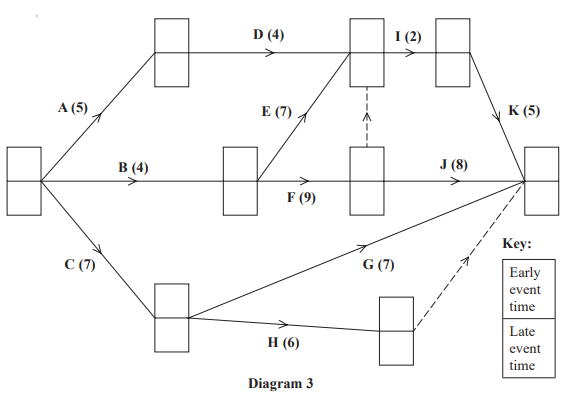
Complete Diagram 3 to show the early event times and the late event times.
State the minimum project completion time.
Calculate a lower bound for the minimum number of workers required to complete the project in the minimum time. You must show your working.
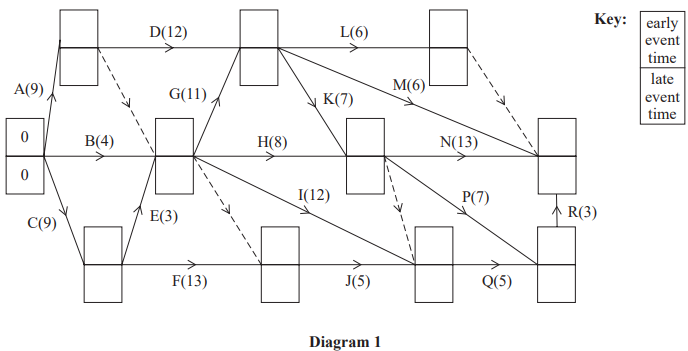
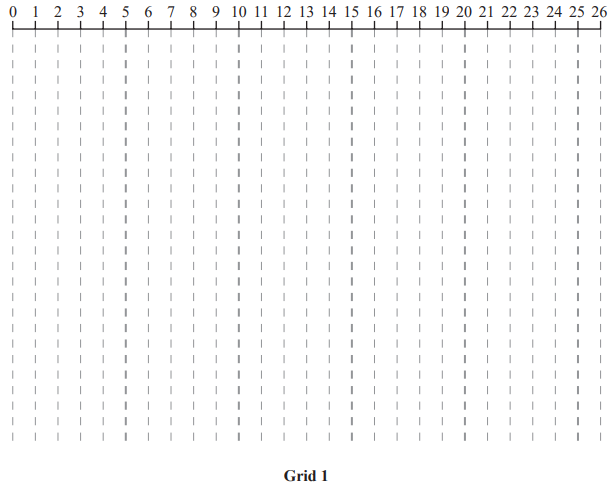
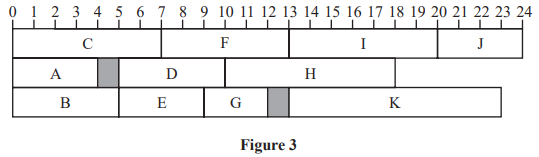
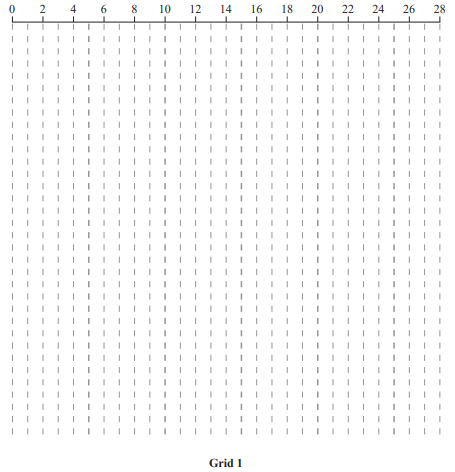
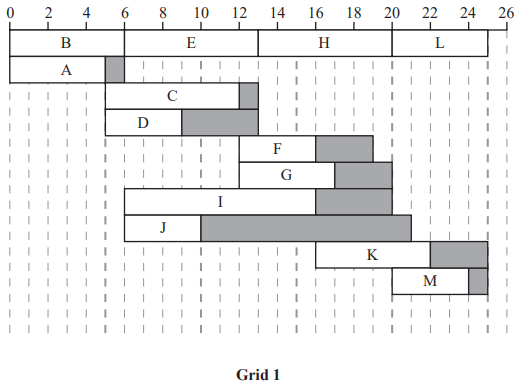
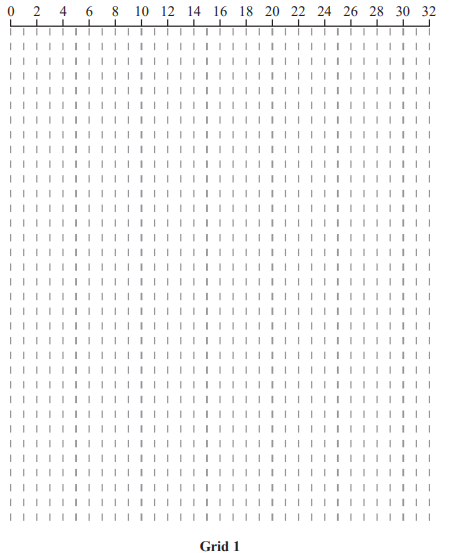
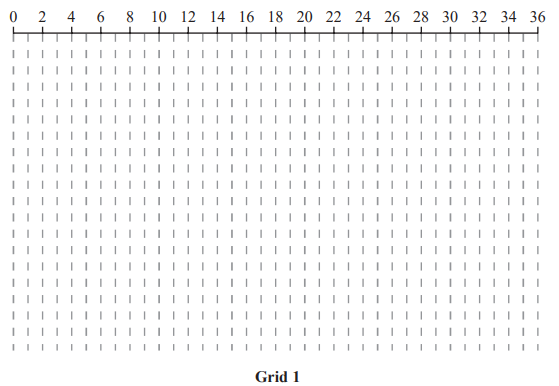
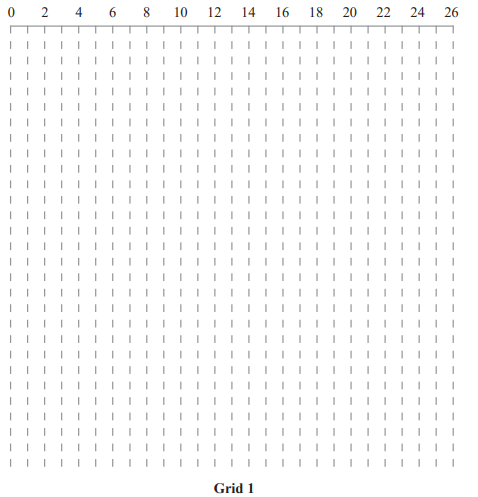
On Grid 1, draw a cascade (Gantt) chart for this project.
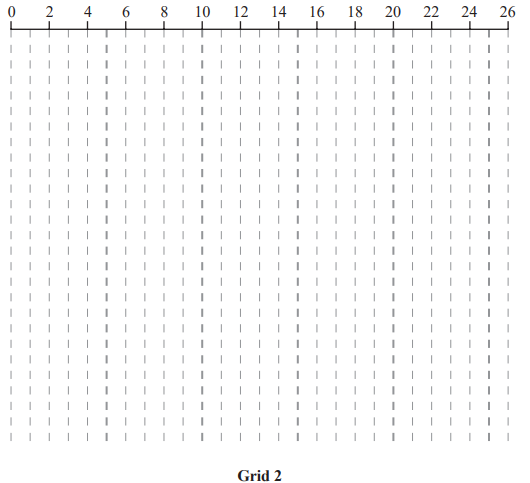
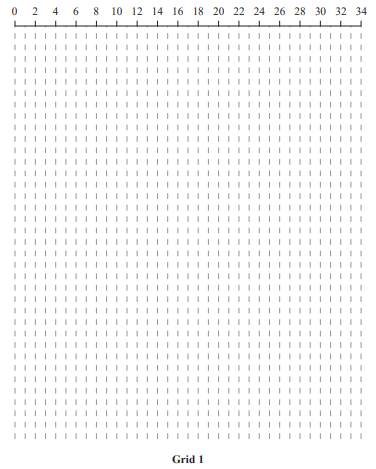
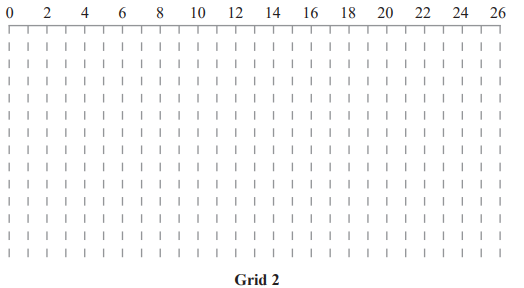
On Grid 2 , construct a scheduling diagram to show that this project can be completed with three workers in just one more hour than the minimum project completion time.
Was this exam question helpful?