Distribution of organisms (SQA National 5 Biology): Exam Questions

Exam code: X807 75

24 mins10 questions
1
Sme Calculator
1 mark

Samples of water were taken from a river at a sewage outlet and at a number of points downstream.

The graph shows the oxygen content of the water at different distances downstream from the outlet.

Graph showing oxygen content increasing from 0 to 1 unit as distance from outlet increases from 0 to 1000 metres, with plotted line and grid.

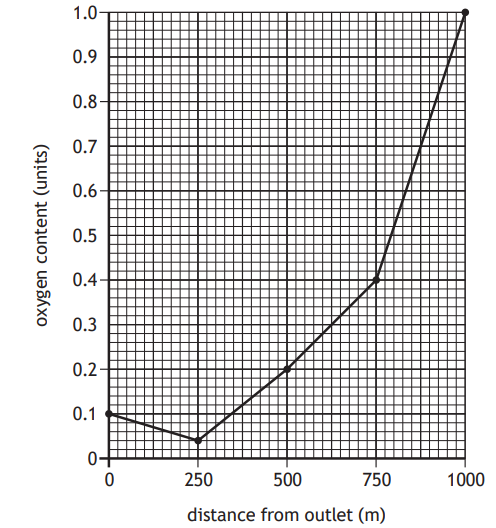
What is the percentage increase in the oxygen content from 250 m to 1000 m from the outlet?

  • 24

  • 96

  • 2400

  • 4900

2a3 marks

In an investigation into the distribution of woodlice in a woodland, students collected and counted them every day for five days using the sampling technique shown.

A roly-poly bug at the bottom of a cutaway soil pit covered with a leaf, depicted in a grey-scale illustration, suggesting camouflage or protection.

(i) Name this sampling technique.

[1]

(ii) Identify two variables that should be kept constant when setting up this sampling technique.

[2]

  1. ....................................................................................

  2. ....................................................................................

2b1 mark

State one way in which the results could be made more reliable.

31 mark

Which of the following is a biotic factor which could affect biodiversity?

  • Soil moisture

  • Temperature

  • Grazing

  • Carbon dioxide concentration

4
Sme Calculator
1 mark

The table shows the results of an investigation into the effect of temperature on egg laying mites.

Feature

Temperature (°C)

20 °C

25 °C

30 °C

Average length of egg laying period (days)

36

27

18

Average number of eggs laid per female during egg laying period

108

108

108

As the temperature increases, the average number of eggs laid per female per day

  • increases

  • decreases

  • stays the same

  • halves

5a
Sme Calculator
2 marks

Students investigated the distribution of some organisms on a rocky shore.

Starting at the lowest tide level, quadrats were placed every two metres along a single transect line and the number of barnacles and mussels were counted.

The results are shown in the table.

Table showing the number of barnacles and mussels across quadrats from low to high tide. Barnacles increase, while mussels decrease.

(i) Calculate the average number of mussels per quadrat.

[1]

................................ mussels

(ii) Describe how the reliability of the results could be improved.

[1]

5b2 marks

Another group of students conducted a study of 10 rock pools found along the transect.

(i) To provide information about the levels of water pollution, samples of water were taken from these rock pools and examined for the presence or absence of certain species.

What name is given to these species?

[1]

(ii) Name the type of factors, such as pH, that can affect the distribution of organisms living in rock pools.

[1]

61 mark

Which statement describes an abiotic factor?

  • The spread of a disease.

  • A period of very low temperatures.

  • An increase in predation.

  • An increase in competition for food.

7a3 marks

Students surveyed an area of woodland and recorded the tree species growing there.

The table shows some features that can be used to identify the trees.

Tree

Needle colour

Needle arrangement

Cones

Scots pine

blue‑green

in pairs

point outwards from stem tip

Norway spruce

green underside

around the branch

point downwards

Douglas fir

grey underside

around the branch

point downwards

Larch

light green

in clusters

point outwards along the stem

Yew

green

in two rows along the branch

absent

Use the information in the table to complete the key.

Flowchart for identifying tree species based on cone presence and needle characteristics, leading to yew, Norway spruce, Scots pine, or larch.
7b2 marks

The students also investigated the effect of soil moisture on the number of Scots pine seedlings growing on the woodland floor.

(i) The students recorded the soil moisture and number of seedlings at 10 sample sites in the woodland.

Suggest why 10 sample sites were used.

[1]

(ii) The students used a moisture meter to measure the soil moisture.

Describe what the students should have done each time they used this apparatus to minimise error.

[1]

81 mark

When investigating the distribution of bluebell plants in a woodland, five quadrats were thrown randomly.

Soil moisture and bluebell abundance values were recorded for each quadrat.

The results are shown in the table.

Quadrat

Soil moisture (%)

Bluebell abundance

1

10

5

2

36

25

3

22

14

4

31

20

5

14

7

Predict the bluebell abundance if the soil moisture was 34%.

  • 13

  • 19

  • 23

  • 27

91 mark

The following paired statement key can be used to identify some birds.

1. Has webbed feet .............................................go to 2
Does not have webbed feet.............................go to 3

2. Has a black head ..............................................puffin
Has a white head...............................................swan

3. Has a curved beak ...........................................go to 4
Has a straight beak ..........................................rook

4. Has a brown head............................................curlew
Has a black head .............................................avocet

Use the information in the key to identify two features of a curlew.

  • Curved beak and a brown head

  • Straight beak and a white head

  • Brown head and webbed feet

  • Straight beak and webbed feet

10a2 marks

Light intensity readings were taken at 5 sites along a transect line running from an open field to a woodland.

Diagram showing a transition from an open field at site 1 to woodland at site 5, with trees gradually increasing from sites 3 to 5.

Name the apparatus used to measure light intensity and give one precaution that should be taken when using it to minimise error.

Apparatus................................................................................................................

Precaution...............................................................................................................

10b2 marks

Three readings were taken at each site at the same time on different days. The results are shown in the table.

Site

Light intensity reading (lux)

Day 1

Day 2

Day 2

1

18 160

17 845

18 180

2

11 500

11 306

11 494

3

14 600

14 550

14 590

4

 5300

4800

5275

5

3600

3200

 3610

(i) Suggest a reason why the readings taken on day 2 were lower than the readings on days 1 and 3.

[1]

(ii) Explain why three readings were taken at each site.

[1]

10c1 mark

Light intensity is an example of an abiotic factor.

Name one other abiotic factor.