1
1 mark
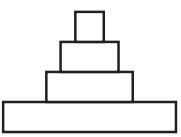
The diagrams represent pyramids of numbers.
Which pyramid represents the following food chain?
grass ![]() rabbit
rabbit ![]() fox
fox ![]() fleas
fleas
Was this exam question helpful?
Exam code: X807 75
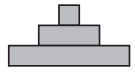
The diagrams represent pyramids of numbers.
Which pyramid represents the following food chain?
grass ![]() rabbit
rabbit ![]() fox
fox ![]() fleas
fleas


Was this exam question helpful?
The diagram shows the transfer of energy through a food chain in an ecosystem.
The numbers represent the energy in the different populations.
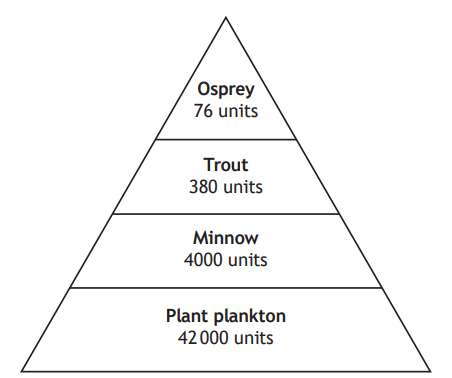
Name the type of diagram shown.
5% of light reaching the plant plankton is converted into new plant material.
Calculate how much energy the plant plankton received.
...............................units
State one way in which energy can be lost from a food chain.
Was this exam question helpful?
The following represents a food chain from a Scottish river.
pond weed ![]() tadpole
tadpole ![]() water beetle
water beetle ![]() pike
pike
Describe the role of pond weed in this food chain and explain what happens to the energy at each level in this food chain.
Was this exam question helpful?
The diagram represents a pyramid of numbers within an ecosystem.
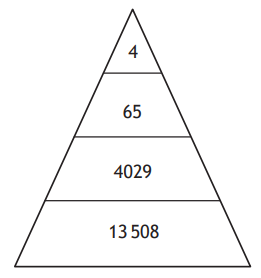
Identify the total number of consumers.
4
4029
4098
17 606
Was this exam question helpful?
Identify the pyramid of energy that would represent the following food chain.
Oak tree ![]() squirrel
squirrel ![]() fox
fox


Was this exam question helpful?
An investigation was carried out to measure the change in body mass in a population of adult locusts kept in a tank at 25 °C. The percentage of food converted into body mass was recorded over a three-week period.
The reliability of the results could be improved by:
decreasing the length of time of the investigation
increasing the mass of food given to the locusts
increasing the number of locusts in the tank
decreasing the temperature in the tank
Was this exam question helpful?