1
1 mark
Nematode worms are used by farmers to prey upon insects that damage their crops.
This method used to increase crop yield is an example of
genetic modification
biological control
pesticide use
fertiliser use
Was this exam question helpful?
Exam code: X807 75
Nematode worms are used by farmers to prey upon insects that damage their crops.
This method used to increase crop yield is an example of
genetic modification
biological control
pesticide use
fertiliser use
Was this exam question helpful?
Which row in the table describes the changes that take place when fertiliser leaches into a river?
Algal population | Light levels | Bacteria numbers | Oxygen concentration | |
A | increases | decrease | increase | decreases |
B | increases | decrease | decrease | increases |
C | decreases | increase | increase | decreases |
D | decreases | increase | decrease | increases |
Was this exam question helpful?
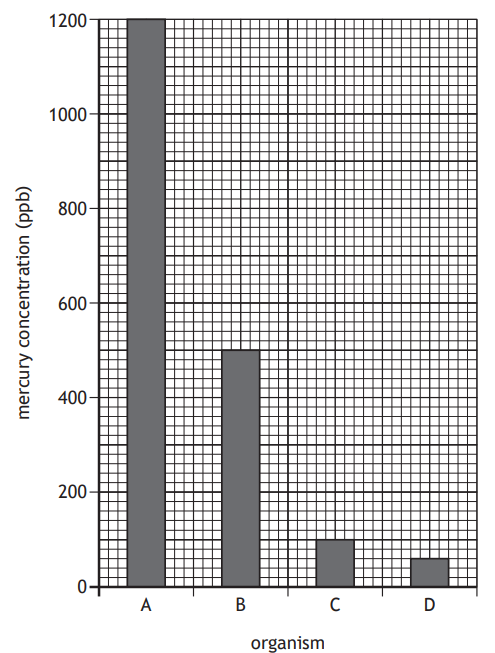
Paints containing toxic mercury compounds were used to paint ships. As a result, mercury entered marine food chains.
The concentration of mercury compounds in the tissues of the organisms in the following marine food chain was measured.
plankton ![]() aquatic insects
aquatic insects ![]() small fish
small fish ![]() large fish
large fish
Which bar on the graph represents the mercury concentration of the small fish?
Was this exam question helpful?
The increasing human population requires an increase in food production.
Name a chemical in fertilisers that helps to increase food yield.
Food crops are often affected by insects and disease.
The table shows the average annual losses in yield caused by insects and disease in the production of four crops in Scotland.
Crop | Average loss in yield (%) | |
Insects | Disease | |
Wheat | 4 | 7 |
Barley | 7 | 6 |
Oats | 8 | 14 |
Oil seed rape | 8 | 12 |
(i) On the grid complete the vertical axis by adding a label and scale and plot the remaining bars to show the average losses in yield caused by disease.
[2]
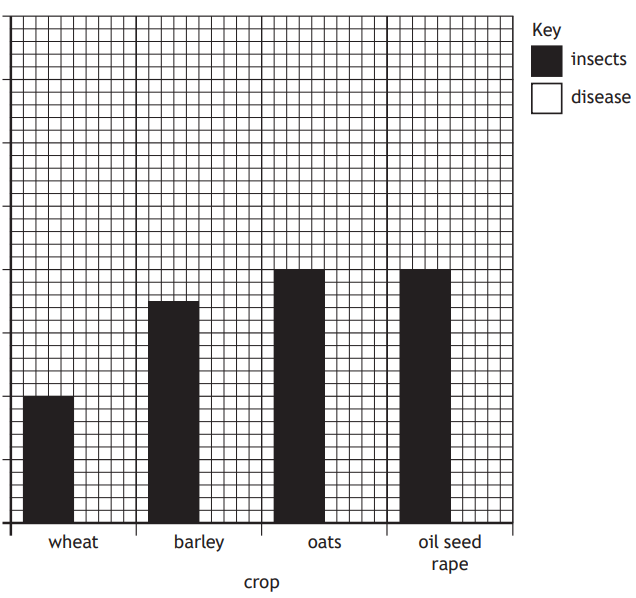
(ii) Identify the crop with the lowest combined percentage loss from these two causes.
[1]
(iii) Explain why it would be incorrect to conclude that the yield for each crop plant is affected more by disease than insects.
[1]
(iv) The total crop of oil seed rape harvested was 140 000 tonnes.
Calculate the yield of oil seed rape that would have been produced if insects and disease had not affected the plants.
[1]
...........................tonnes
Over time pesticides can build up in the cells of living organisms.
State the term given to this build‑up of pesticides
Sometimes a predator of the pest species is used as an alternative to pesticides.
Name this method of reducing pest species.
Was this exam question helpful?
The table shows the concentration of different metal ions in the liver of a fish and in water.
Metal | Concentration of metal ion | |
in liver (mg/kg) | in water (mg/l) | |
Cadmium | 2.62 | 0.004 |
Copper | 13.28 | 0.04 |
Iron | 494.0 | 0.76 |
Zinc | 55.79 | 0.07 |
The bioaccumulation factor (BAF) of metals can be calculated using the following formula:
![]()
The metal with the highest bioaccumulation factor is
cadmium
copper
iron
zinc
Was this exam question helpful?
Nematode worms can be used by farmers to decrease the number of insects that damage their crops.
This describes the use of
GM crops
biological control
pesticides
fertilisers
Was this exam question helpful?
An investigation was carried out into the effect of modifying cotton plants on the yield of cotton.
Three farms had two fields of cotton, one of each type: original and modified.
The yields of both types were recorded.
The results are shown in the table.
Yield of cotton (kg) | ||
Farm | Original type | Modified type |
1 | 340 | 510 |
2 | 240 | 348 |
3 | 380 | 540 |
Calculate the percentage increase in yield when using modified cotton in farm 2.
.............................%
(i) Identify the variable altered in this investigation.
[1]
(ii) Suggest a variable that would have to be controlled to ensure validity.
[1]
The fields planted with the original type of cotton were used as a control.
Give a reason for using a control in this investigation.
Describe how the reliability of these results could be improved.
Was this exam question helpful?
Farmers use fertilisers with a high nitrate content to increase the yield of crops.
The diagram shows two possible fates of nitrates in fertilisers.
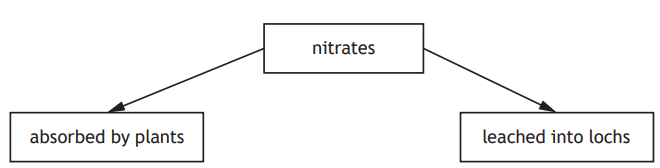
Describe how the leaching of nitrates can result in a reduction in the number of freshwater organisms in lochs.
Was this exam question helpful?
The graph shows the concentration of nitrate in a river measured on the first day of each year.
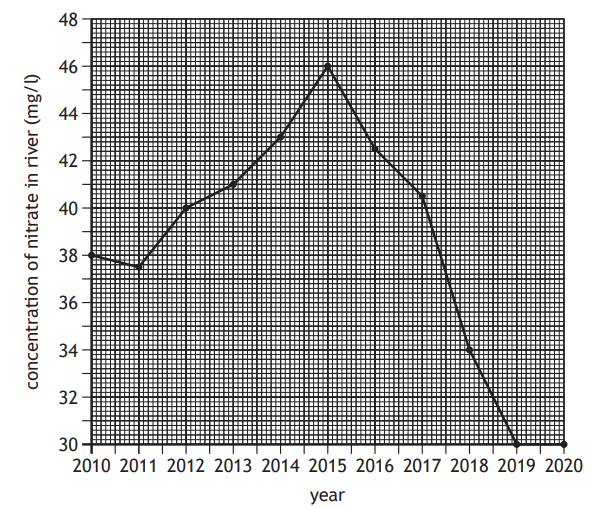
A valid conclusion from this data would be:
nitrate concentration increased every year between 2010 and 2014
there was a greater increase in nitrate concentration between 2011–2012 compared to between 2014–2015
no nitrates were present in river water between 2019 and 2020
the greatest decrease in nitrate concentration was between 2017 and 2018
Was this exam question helpful?
The bar chart shows the percentage loss in yield of four crops and the cause of loss.
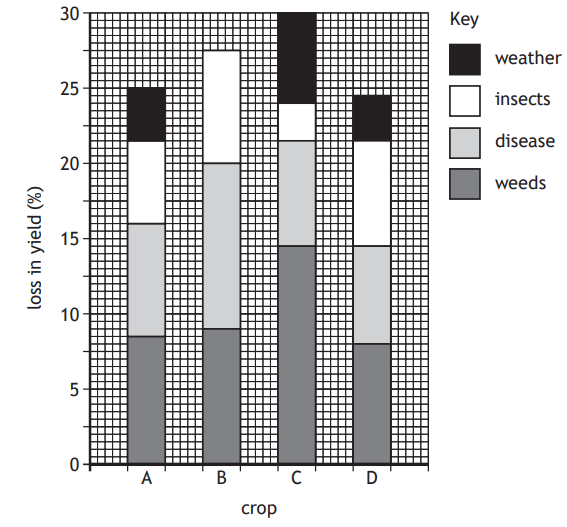
To reduce losses, pesticides can be sprayed onto the crops to kill weeds and insects.
Predict which crop is most likely to show the greatest percentage increase in yield, when the crops are sprayed with pesticides.
Was this exam question helpful?
Plant growth can be improved if the soil has a suitable nitrate content.
(i) Describe the use of nitrates in a plant.
[1]
(ii) Nitrates can be found in compost.
The table gives some information about the nutrient content of three different composts.
Type of compost | Carbon content (g/100 g) | Nitrogen content (g/100 g) | Carbon :Nitrogen ratio |
R | 9.45 | 1.35 | 7:1 |
S | 14.40 | 24:1 | |
T | 9.80 | 0.20 | 49:1 |
Complete the table by calculating the nitrogen content in 100 g of compost S.
[1]
Nitrates can leach from the soil into nearby rivers.
(i) Give the term that describes the increased growth of algae caused by leached nitrates.
[1]
(ii) Explain how this increase in algae can cause aquatic plants in a river to die.
[2]
Was this exam question helpful?