Photosynthesis (SQA National 5 Biology): Exam Questions

Exam code: X807 75

27 mins10 questions
11 mark

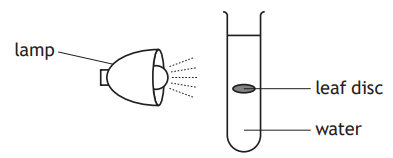
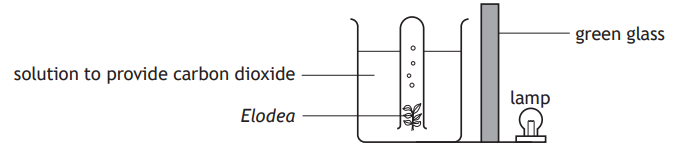
The diagram shows an experiment used to investigate the conditions needed for photosynthesis.

All four tubes contained pondweed and water.

Four test tubes with seaweed, labelled 1 to 4. Tubes 1 and 2 are in light; 3 and 4 in a dark box. Carbon dioxide levels vary as shown below each tube.

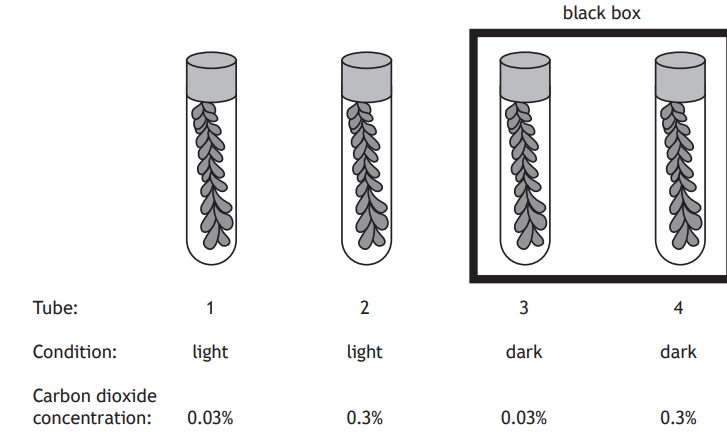
Which two tubes should be compared to show the effect of light on photosynthesis?

  • 1 and 2

  • 1 and 4

  • 2 and 3

  • 2 and 4

21 mark

The graph shows the effect of limiting factors on the rate of photosynthesis.

Graph shows photosynthesis rate in bubbles of oxygen per minute at varying light intensity, comparing 1.0% and 0.1% CO2 at 30°C.

Which row in the table identifies the limiting factors at points X and Y on the graph?

X

Y

A

light intensity

temperature

B

light intensity

CO2 concentration

C

temperature

light intensity

D

CO2 concentration

light intensity

    3a
    Sme Calculator
    1 mark

    An experiment into photosynthesis was carried out.

    Diagram showing a lamp shining on a test tube containing water and a floating leaf disc, demonstrating a photosynthesis experiment setup.

    After the lamp was switched on, the time taken for the leaf disc to float to the surface was recorded.

    The experiment was repeated five times and the results are shown in the table.

    Experiment

    1

    2

    3

    4

    5

    Time taken for disc to float to surface (seconds)

    18.4

    17.8

    16.6

    11.7

    13.8

    Calculate the average time taken for the leaf disc to float to the surface.

    .......................seconds

    3b1 mark

    A gas produced during the first stage of photosynthesis diffuses out of the cells, causing the leaf discs to float to the surface.

    Name this gas.

    3c1 mark

    During photosynthesis the light energy from the lamp is converted into chemical energy.

    Name the molecule generated by this chemical energy that is then used in the second stage of photosynthesis.

    3d2 marks

    The second stage of photosynthesis is affected by temperature.

    Name this stage and give a reason.

    Stage.............................................................................................................

    Reason...........................................................................................................

    41 mark

    In an investigation into photosynthesis, a green plant was set up as shown and left in the light for 2 days.

    Diagram of a potted plant with leaves P, Q, and R. Leaf P is in a bag with CO2-absorbing chemical, leaf Q is covered in black paper.

    Leaves P, Q and R were then tested for the presence of starch.

    In which of the leaves was starch present?

    • Leaf P only

    • Leaf R only

    • Leaves P and R only

    • Leaves P, Q and R

    5a3 marks

    An experiment was carried out to investigate the effect of carbon dioxide concentration on the rate of photosynthesis. The rate of photosynthesis was measured by recording the mass of sugar produced per hour.

    Graph showing mass of sugar produced versus carbon dioxide concentration. Sugar production increases linearly to 20 g/hour at 0.10% then levels off.

    (i) Describe the relationship shown between carbon dioxide concentration and the mass of sugar produced.

    [2]

    (ii) Suggest one factor that could be limiting the rate of photosynthesis at point X in the graph.

    [1]

    5b3 marks

    (i) Hydrogen is a product of the light reactions and is required for carbon fixation.

    Describe how this hydrogen is produced.

    [1]

    (ii) The sugar produced during the carbon fixation stage can be converted into other substances, such as starch.

    Name one other substance sugar can be converted into and state its role in the cell.

    Substance .........................................................................................................

    Role....................................................................................................................

    61 mark

    An experiment was set up to investigate the effect of changing carbon dioxide concentration on the rate of photosynthesis.

    The results are shown in the graph.

    Graph showing volume of oxygen produced versus carbon dioxide concentration. Oxygen production rises to 1.5 cm³ at 3% CO2 and levels off, marked at point X.

    Which of the following factors could be limiting the rate of photosynthesis at point X?

    • Carbon dioxide concentration and light intensity

    • Light intensity and temperature

    • Temperature only

    • Carbon dioxide concentration only

    7a1 mark

    Photosynthesis is a two‑stage process that takes place in the leaves of green plants.

    State the source of energy for the first stage.

    7b
    Sme Calculator
    3 marks

    (i) Name the process by which oxygen moves out of the leaf through stomata.

    [1]

    (ii) The number of stomata on both surfaces of five leaves was counted and averages calculated.

    The results are shown in the table.

    Leaf

    Number of stomata

    Upper surface

    Lower surface

    1

    4

    12

    2

    20

    23

    3

    8

    15

    4

    12

    22

    5

    16

    Average

    12

    18

    Complete the table to include the number of stomata on the lower surface of leaf 5.

    [1]

    (iii) Name a substance that enters the leaf through stomata.

    [1]

    7c2 marks

    (i) Describe how sugar is produced in the second stage of photosynthesis.

    [1]

    (ii) Name one substance that the sugar produced could be converted into.

    [1]

    81 mark

    Which row in the table describes changes in conditions that may improve the growth of plants in a greenhouse?

    Light intensity

    Carbon dioxide concentration

    A

    decrease

    decrease

    B

    decrease

    increase

    C

    increase

    decrease

    D

    increase

    increase

      91 mark

      An experiment was carried out to investigate the effect of green light on the rate of photosynthesis in the pondweed, Elodea.

      Diagram of an experiment setup with Elodea in a solution producing carbon dioxide, a green glass filter, and a lamp positioned beside the glass.

      Which of the following changes would provide a suitable control for this experiment?

      • Replace the solution with water.

      • Increase the brightness of the lamp.

      • Use a different species of pondweed.

      • Replace green glass with clear glass.

      10a1 mark

      When light is absorbed by a plant, photosynthesis takes place and as a result substance K is released from the leaves.

      Diagram of a potted plant with arrows showing sunlight and "substance K" affecting it, illustrating a process like photosynthesis.

      Name substance K.

      10b1 mark

      Describe the energy change that takes place during the first stage of photosynthesis.

      10c2 marks

      The graph shows the effect of increasing light intensity on the rate of photosynthesis at two different temperatures. All other factors were kept constant.

      Graph showing the rate of photosynthesis versus light intensity at 15°C and 25°C. Higher rate observed at 25°C, with lines marked M and N.

      Identify the limiting factor at each of the points M and N.

      M...........................................................................................................................

      N............................................................................................................................