Choropleth Maps & Synoptic Charts (SQA National 5 Geography): Revision Note
Exam code: X833 75

Written by: Bridgette Barrett
Updated on
Map types
Thematic maps
Thematic maps tell a story about a place by showing quantitative data
There are five types of thematic maps:
Choropleth maps
Dot distribution maps
Graduated symbol maps
Isoline maps
Cartograms
Choropleth maps
Choropleth maps use tone or colour to represent spatial data

Examiner Tips and Tricks
Choropleth maps are the most common type of map you will encounter in the National 5 exam. Ensure that you check the title and the key; these will give you lots of information about what the map is showing.
One of the most common questions is to describe the distribution or pattern shown on a map. Remember:
Look for the overall pattern, is it related to levels of development or some other feature
Where are the highest/lowest?
Use country, region or continent names
Use other features as reference points, such as the equator or tropics
Worked Example
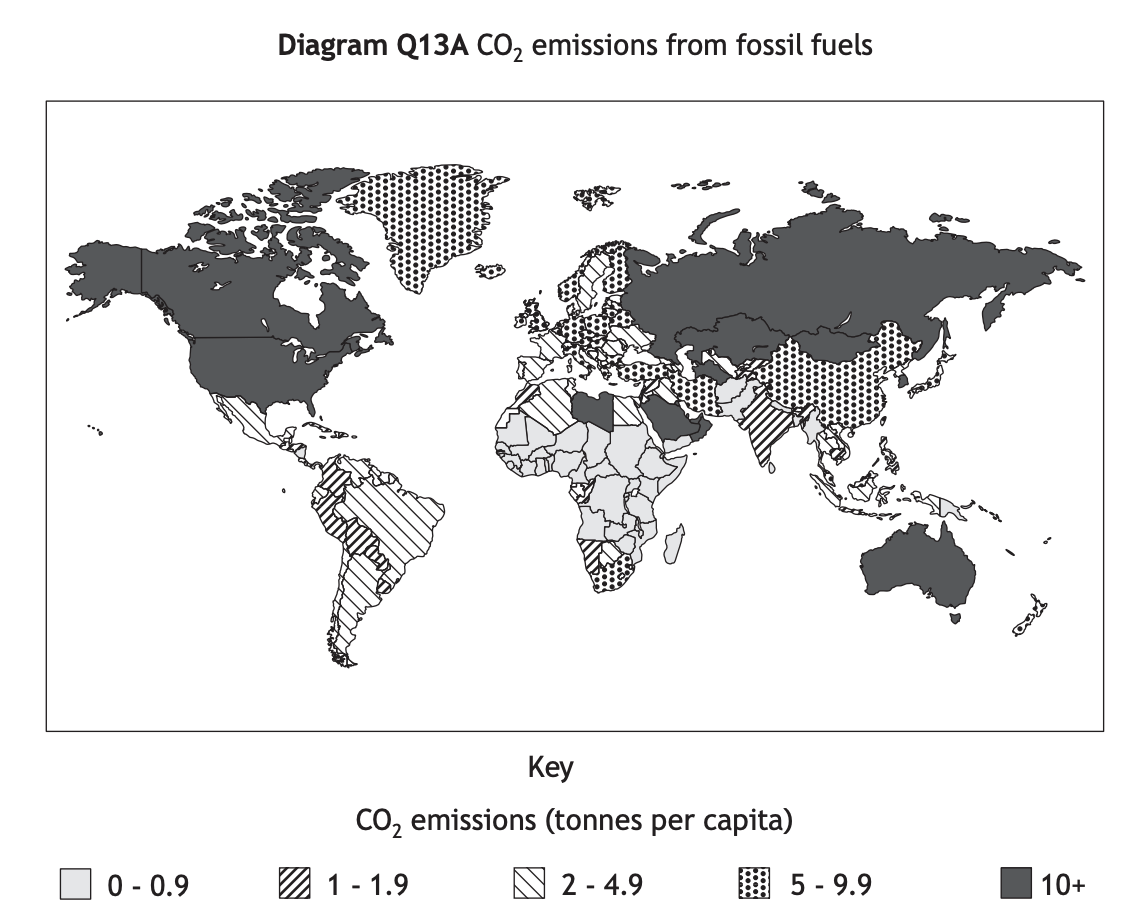
Study Diagram Q13A.
Describe, in detail, the global distribution of CO2 emissions from fossil fuels.
Answer
Overall, developed countries emit more CO2 than developing countries. [1] Countries with the lowest CO2 emissions (0-0.9) include Pakistan, Myanmar and much of central Africa. [1] Countries emitting between 2-4.9 tonnes per capita include Mexico, Brazil and Algeria. [1] Whereas the largest emitters with over 10 tonnes per capita include Australia and the USA. [1]
Synoptic charts
Meteorological station readings are plotted on synoptic charts
They can show some or all of the following:
Wind speed
Wind direction
Pressure patterns
Weather fronts
Cloud cover
Temperatures
Examiner Tips and Tricks
In the exam, you may be expected to match locations to weather conditions shown on a synoptic chart. You need to be confident about the symbols used and what they mean.
Worked Example
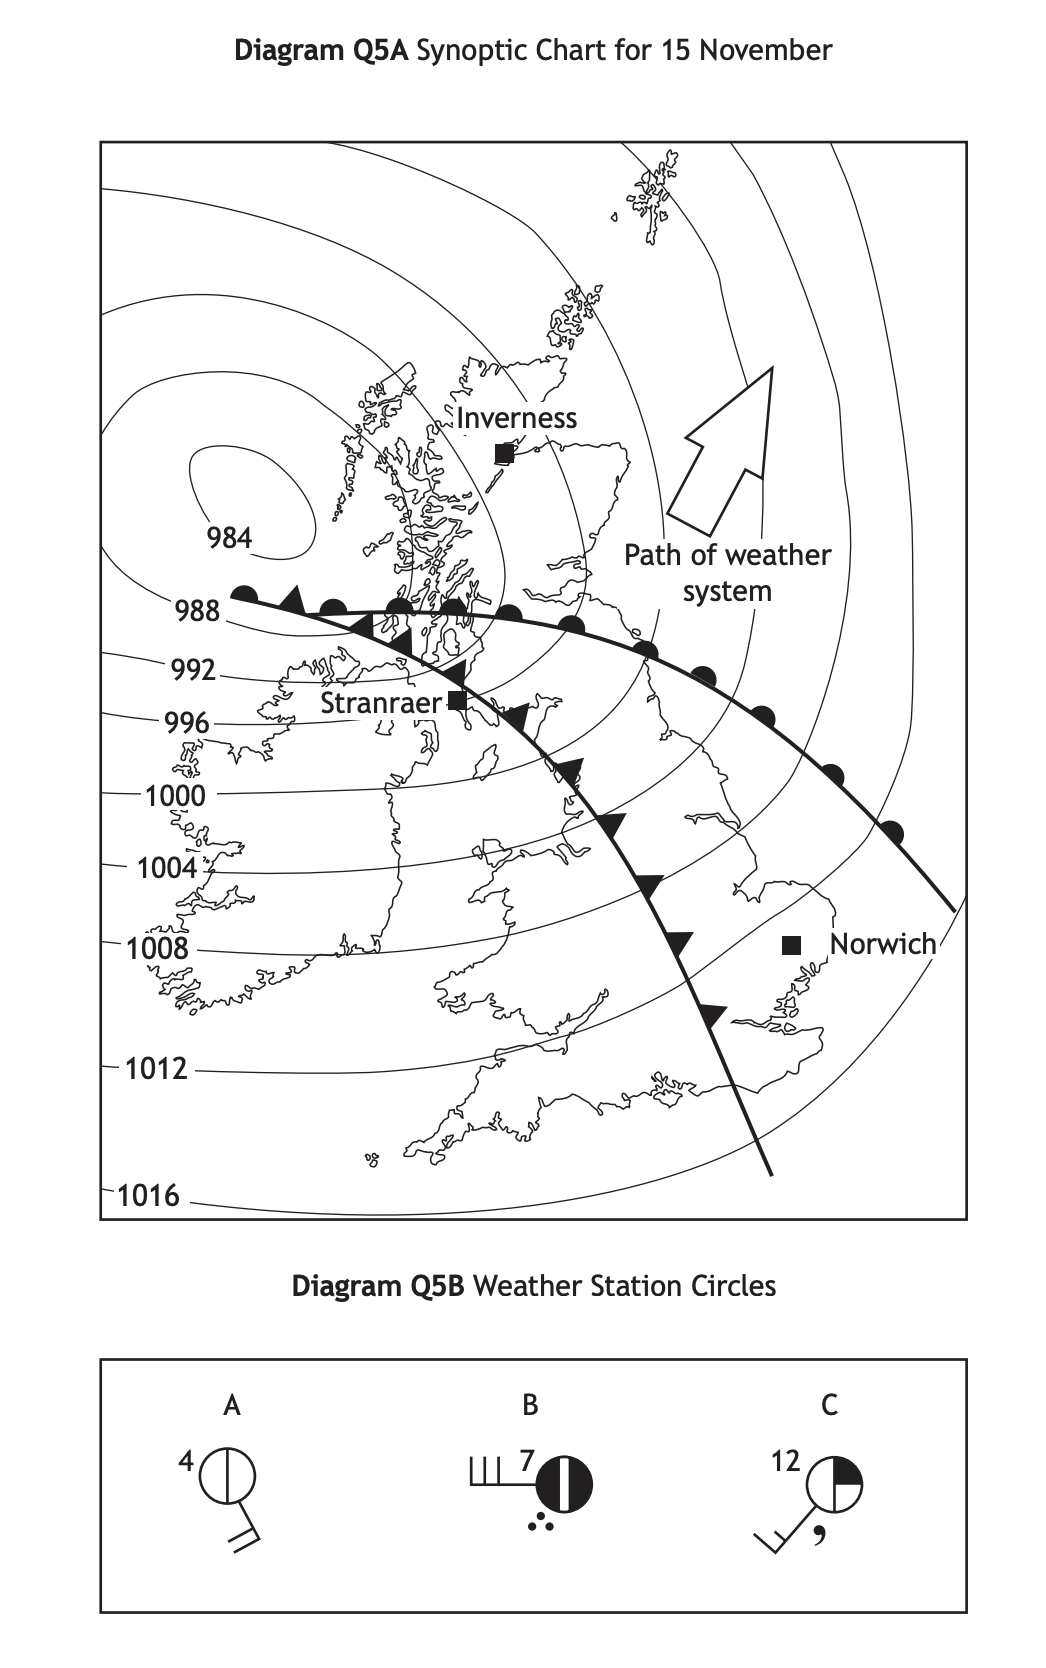
Diagram Q5B shows the weather conditions in 3 locations on the map: Locations:
Norwich Stranraer Inverness
Match the weather station circles, A, B and C with the correct location.
Answer
A = Inverness ( a temperature of 4oC, one okta of cloud, a 20 knot south-easterly wind )
B = Stranraer ( a temperature of 7 °C, seven oktas of cloud, a 30 knot westerly wind and heavy rain)
C = Norwich (a temperature of 12oC, two oktas of cloud, a 15 knot south-westerly wind and drizzle)
As the low-pressure system moves across the country, the weather changes. Ahead of the warm front where Inverness is located, the temperatures are cold but there is little cloud. Between the warm front and cold front, where Norwich is located, there is warm air, so the temperature is higher. Whereas Stranraer is below the cold front, so there is lots of rising warm air and leading to heavy rain, strong winds and lower temperatures.

Unlock more, it's free!
Join the 100,000+ Students that ❤️ Save My Exams
the (exam) results speak for themselves:

Was this revision note helpful?