Use of Social & Economic Development Indicators (SQA National 5 Geography): Revision Note
Exam code: X833 75

Specification checklist
This page covers what you need to know from the SQA National 5 geography specification to answer questions on:
Use of social and economic indicators.
What is a development indicator?
Development refers to a country's progress in improving the standard of living and quality of life of its population
The quality of life includes subjective factors like happiness
A country's level of development is measured using the following indicators:
Social indicators (for example, life expectancy)
Economic indicators (for example, Gross Domestic Product (GDP))
Combined indicators which use a range of measures
Types of social development indicators
Social indicators provide a more complete picture of a country's development
They show how the country's money helps its people
Life expectancy at birth
Literacy - the % of people who can read and write
Infant mortality
People per doctor
Quality of life and social well-being
Equal opportunities; access to services such as education and healthcare
Life expectancy at birth
Life expectancy is the average age a person can be expected to live when they are born
Various factors impact life expectancy
Physical and human environmental factors
Personal lifestyle
Incidence of disease
Access to healthcare
Life expectancy is higher in developed countries than in developing countries
Infant mortality
The infant mortality rate refers to the number of children per 1000 live births who die before the age of 1
Over 18 countries have an infant mortality rate of over 50 per 1000
These are all developing countries
Most of these countries are in Sub-Saharan Africa
Infant mortality rates are higher in developing countries than in developed countries due to:
Less access to healthcare
Poorer diets
Less access to clean water
Poorer sanitation
Literacy rate
Literacy rate is a measure of the percentage of people over 15 years old who can read and write
In developed countries, literacy rates average 96%
Developing countries have average literacy rates of 65%
This can be hard to measure in developing countries due to a lack of monitoring
Conflict zones and informal settlements are particular areas where it is difficult to measure literacy rates
In developing countries:
Access to schools is more difficult, particularly in rural areas
People are less likely to be able to afford to send their children to school
Children are more likely to miss school due to illness or by helping the family with farming or fetching water
Children, particularly girls, are less likely to attend secondary school
People per doctor
People per doctor is the number of people each doctor is responsible for treating in a country or region
A lower number (more doctors per person) usually means that a country is more developed because it means that the healthcare system is stronger
However, it is a limited measure because
People may access healthcare advice through mobile phones or other methods that aren't reflected in the official doctor count
Access to healthcare may be limited for certain populations due to insurance or socioeconomic factors
The ratio can vary significantly between urban and rural areas within a country
Types of economic development indicators
Economic indicators relate to income, job security and standards of living
However, some of these are averages of a population and do not take into account inequalities such as unequal wealth
The % of people employed in agriculture
Gross Domestic Product (GDP)
GDP per capita (average income)
Employment in agriculture
Mechanisation leads to fewer people being employed in agriculture, a primary activity
This is more common in developed countries, where farmers have sufficient income to buy machines like combine harvesters and tractors
In developed countries, fewer people work in agriculture because they can afford to import food
The UK imports over 40% of its food supply
More people in developed countries work in secondary and tertiary activities, which often pay higher wages, leading to a better standard of living
In developing countries, where more people are employed in agriculture, this leads to low incomes and reduced economic development
Gross Domestic Product (GDP)
Gross Domestic Product (GDP) is the total value of goods and services produced within a country in a year
A higher GDP usually indicates a wealthier and more developed country
High GDP is often the result of a country having many industries producing high-value goods
The money can then be invested in services, such as education and healthcare
Gross Domestic Product (GDP) per capita
Gross Domestic Product (GDP) per capita is the total value of goods and services produced within a country in a year, divided by the population of the country
There can be huge differences in GDP depending on the size and population of a country
Dividing it by the population means that more meaningful comparisons can be made between countries
GDP per capita is an average; this means that the variation in wealth is hidden
It is possible that two countries can have the same average GDP per capita but that one has a few very wealthy people and lots of people living in poverty, whereas the other has a more equal distribution of wealth
Examiner Tips and Tricks
Remember, increasing wealth is not equally distributed. In all countries, some people will benefit more from the cycle of wealth and economic development. Often, as a country develops, the gap between the rich and the poor increases.
Worked Example
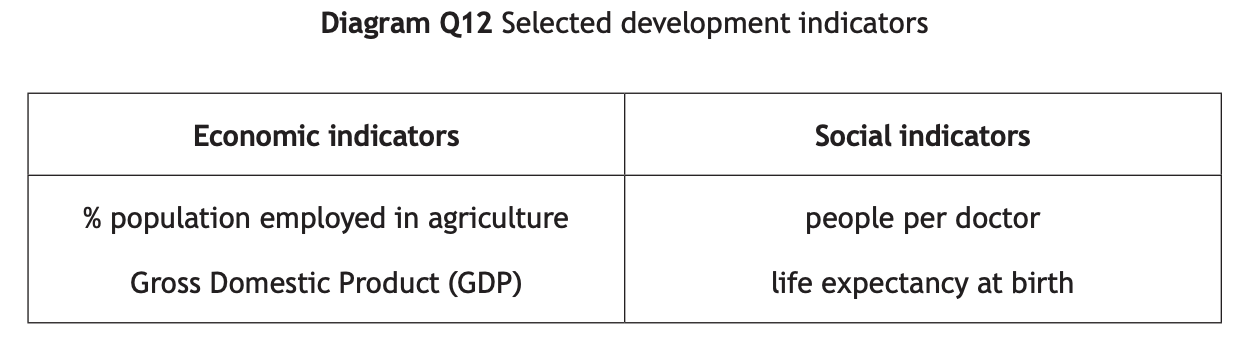
Study Diagram Q12.
Choose one economic and one social indicator from the table above.
Explain the ways in which your chosen indicators show the level of development in a country.
[4 marks]
Example answer
% population employed in agriculture
People earn lower wages in agriculture, which leads to a lower standard of living [1] countries with higher percentages of people employed in agriculture tend to be developing. [1]
Life expectancy at birth
In developed countries, there is better access to more advanced health treatments such as chemotherapy [1]. This means that people live longer. [1]
One mark is awarded for each valid point
Answers that only refer to one indicator (economic or social) will gain a maximum of two marks
Types of combined indicators of development
Human Development Index (HDI)
The UN created the Human Development Index (HDI) in 1990 as a better way of measuring differences between countries
The index takes into account four indicators of development:
Life expectancy at birth indicates the overall health of a country
Mean years of schooling for adults aged 25 years
It is a measure of the educational level of a population's adults
Expected years of schooling for a child of school entrance age (the number of years of schooling that a child of school entrance age can expect to receive)
It shows how well the younger generation will do in school
Gross National Income (GNI) per capita (PPP$)
Countries can be divided into four groups using the HDI
Very High Human Development (VHHD)
High Human Development (HHD)
Medium Human Development (MHD)
Low Human Development (LHD)
HDI is scored from 0 to 1
The higher the HDI, the higher the level of development and quality of life
Norway has the highest HDI at 0.957 (2024)
Niger has the lowest HDI at 0.394 (2024)

The index only takes into account four indicators of development and the statistics provided by some countries may be unreliable and subjective
It is a general measure based on average calculations
It does not take into account disparities (differences) that might exist within a country
It does not take into account environmental or political measures
Some consider it still to be too simple and biased in favour of HICs, as income is weighted
Physical Quality of Life Index (PQLI)
Developed in the 1970s, the PQLI is a composite index which measures the physical well-being of a population
The index takes into account three indicators of development:
Life expectancy at age 1
Infant mortality rate
A lower infant mortality rate is an indicator of better healthcare, sanitation and nutrition
Basic literacy rate
This is a measure of the educational level of a population's adults
Higher literacy leads to better job opportunities and improved living standards
The PQLI is measured on a scale of 0 to 100
The lowest score is 0 and the highest is 100

Unlock more, it's free!
Join the 100,000+ Students that ❤️ Save My Exams
the (exam) results speak for themselves:

Was this revision note helpful?
