Population Structure & Change (SQA National 5 Geography): Revision Note
Exam code: X833 75

Specification checklist
This page covers what you need to know from the SQA National 5 geography specification to answer questions on:
Factors affecting birth and death rates
Demographic transition model
The demographic transition model (DTM) illustrates the five generalised stages that countries pass through as they develop
It shows how the birth and death rates change and how this affects the overall population as the country develops

Stage 1
The total population is low
High birth rates due to a lack of contraception/family planning
High death rates due to poor healthcare, poor diet and famine
High infant mortality leads people to have more children, so that some children survive to adulthood
Stage 2
The total population starts to rise rapidly
Birth rates remain high as people continue to have large families
Death rates decrease as a result of improved diets, better healthcare, lower infant mortality and increased access to clean water
Stage 3
The total population continues to increase but the rate of growth slows down
Birth rate starts to fall rapidly due to increased birth control, family planning, increased cost of raising children and low infant mortality rate
Death rate is still decreasing but at a slower rate, as improvements in medicine, hygiene, diet and water quality continue
Stage 4
The total population is high and is slowly increasing
The birth rate is low and fluctuating, as there is accessible birth control and more women are choosing to have fewer children and delay the age at which they start to have children
The death rate is low and fluctuates
Stage 5
The total population starts to slowly decline as the death rate exceeds the birth rate
The birth rate is low and slowly decreasing
The death rate is low and fluctuates
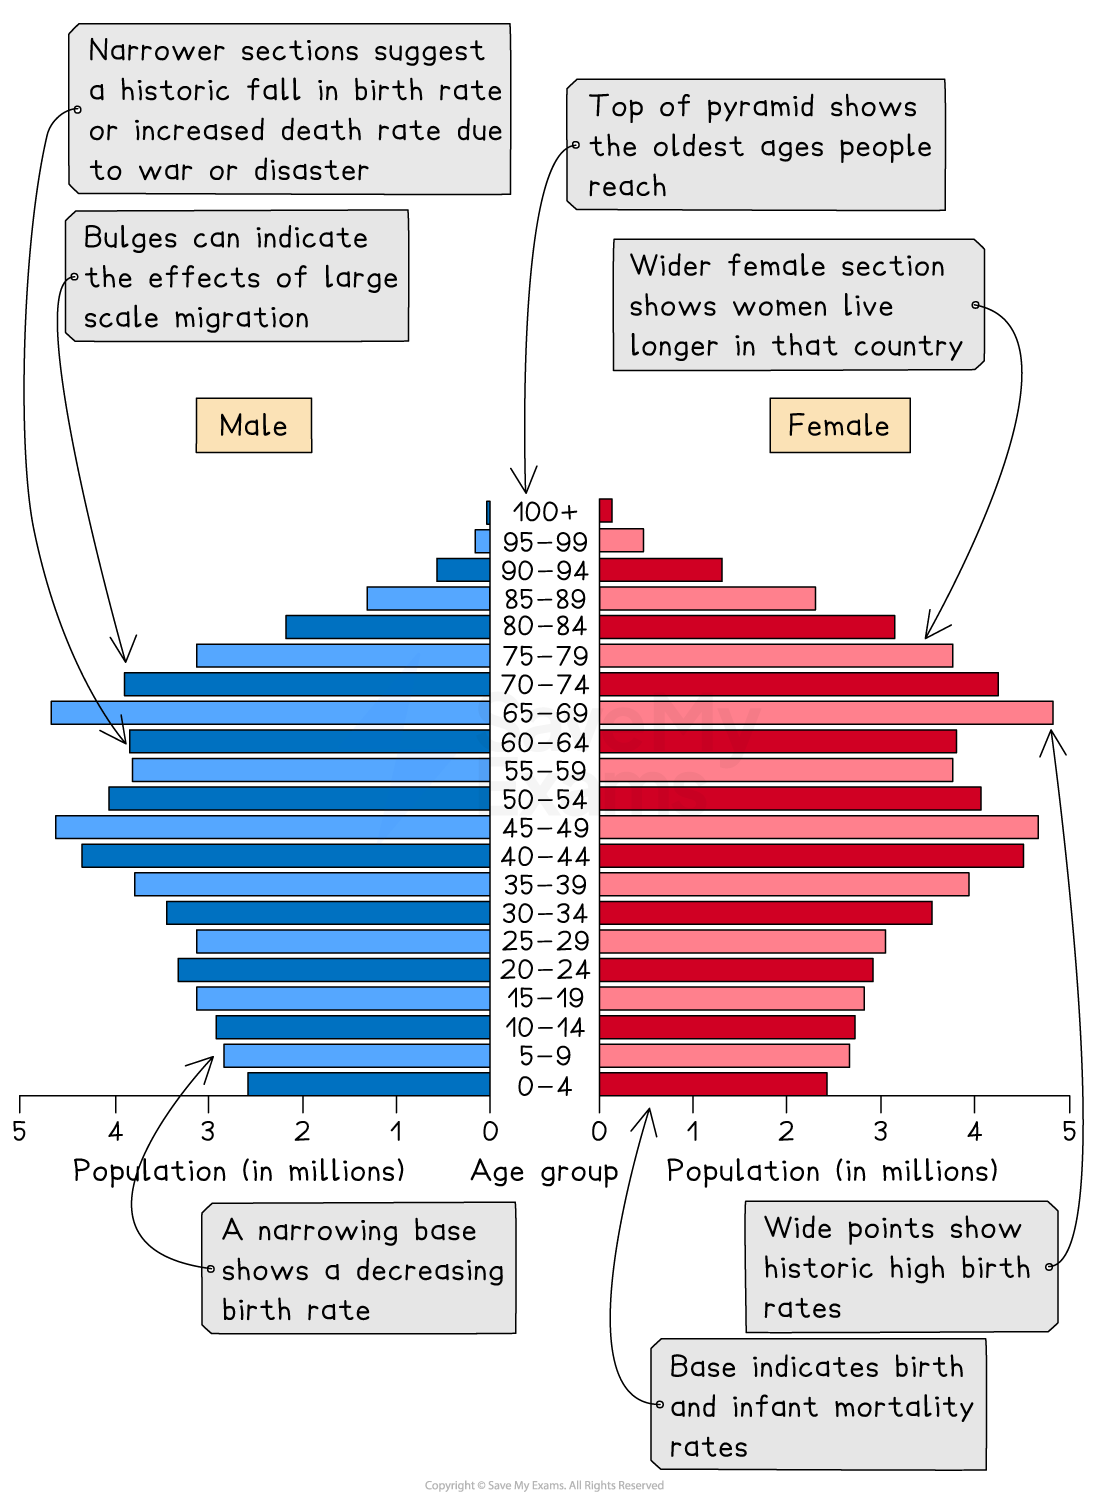
Population pyramids
The characteristics of a population—the distribution of age, sex, ethnicity, religion, etc.—are known as the population structure
The population structure is the result of changes in:
Birth rate
Death rate
Migration
The two main components of age and sex can be shown on a population pyramid
Population pyramids (also known as an age structure diagram) are a type of graph which can be used to illustrate the structure of a population
They illustrate the distribution of population across age groups and between males/females
They enable governments nationally and regionally to assess the needs of the population for services such as healthcare and education
This means the governments can estimate and plan for spending
As countries develop and pass through the stages of demographic transition, the shape of the population pyramid changes
The population pyramid can be used to identify the following groups:
Young dependents
Old dependents
Economically active (working population)
Dependency ratio

The least developed countries, like Niger, have a concave pyramid shape
At the start of stage 2 of the demographic transition model
This indicates:
High birth rate
Low life expectancy
High death rate but starting to decrease
High infant mortality rate
The young dependent population dominates

Developing countries such as Nepal have a pyramid shape
Stage 3 of the demographic transition model
This indicates:
Decreasing birth rate
Increasing life expectancy
Decreasing death rate
Decreasing infant mortality
Larger working-age population

Developed countries such as the USA have a column-shaped
Stage 4 of the demographic transition model
This indicates:
Decreasing birth rate
Increasing life expectancy
Decreasing death rate
Low infant mortality
Larger working-age population

Developed countries such as Japan have a pentagon shape with a narrowing bottom
Stage 5 of the demographic transition model
This indicates:
Decreasing birth rate
Increasing life expectancy
The death rate is higher than the birth rate due to the ageing population
Low infant mortality
Ageing population
Worked Example
Study Diagram Q9A
Give reasons for the differences between the population structures of Austria and Nigeria.
You should refer to both birth rates and death rates in your answer
[6 marks]
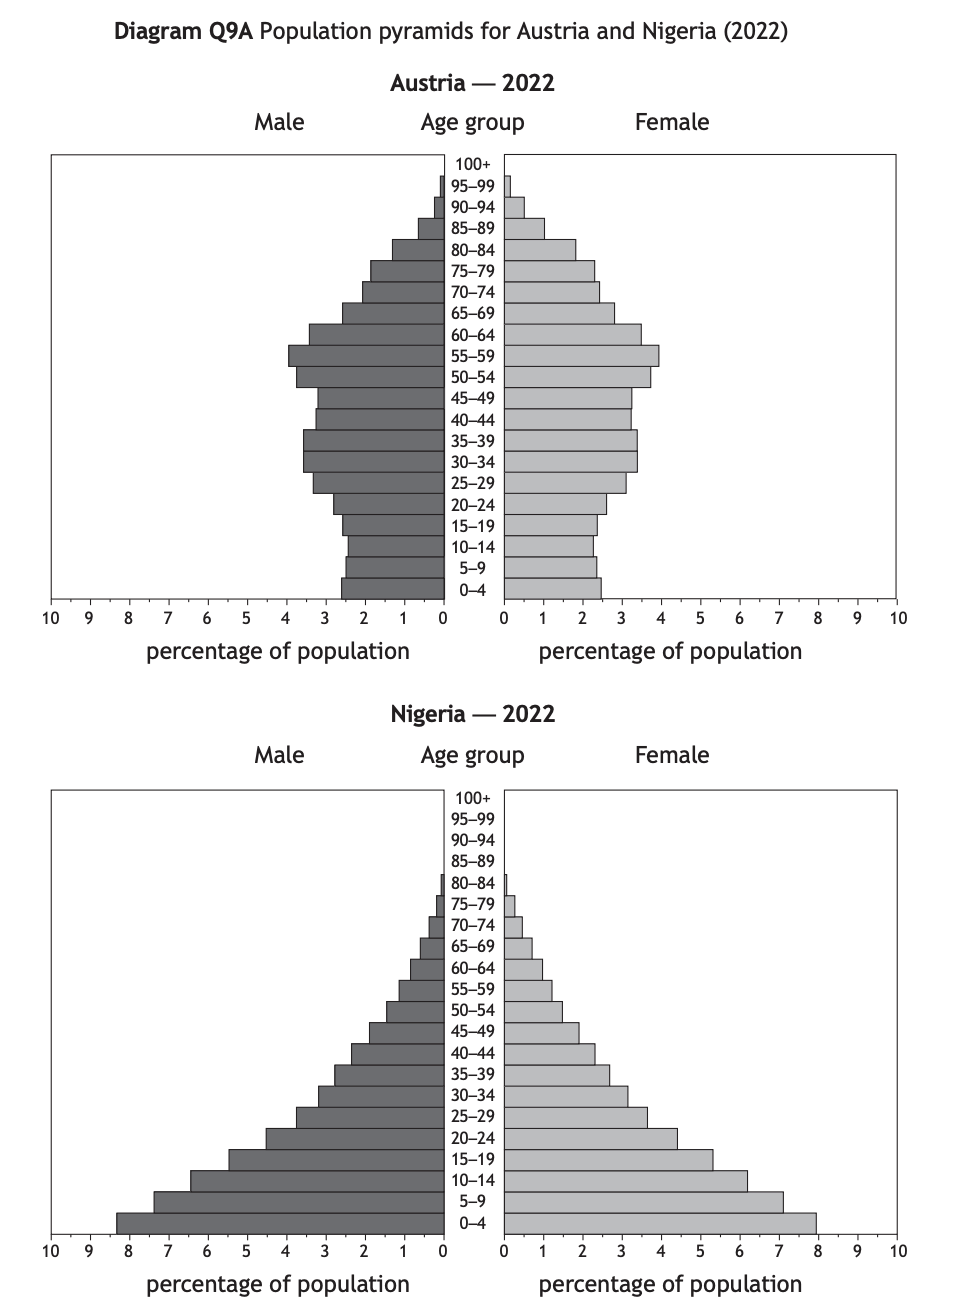
Example answer
A higher percentage of the population in Nigeria is under 15, as women often lack access to education [1] and information on contraception is less easily available. [1] In Austria, women are more likely to have careers and this reduces the birth rate. [1]
A higher percentage of the population in Austria is elderly (over 60) due to better access to healthcare, [1] which means they are less likely to die of illness or disease before 60.[1] In Nigeria, poorer diets mean more people are likely to suffer malnutriton which increases the chances of them dying at an earlier age. [1]
Examiner Tips and Tricks
A common question in the exam asks students to compare the population pyramid of a developing country and the population pyramid of a developed country. This came up in both the 2023 and 2025 exams.
You will be expected to give reasons for the differences and refer to both birth rates and death rates in your answer. Ensure that you can link the factors which affect birth and death rates to the different structures of the population pyramids. You will not be awarded marks for describing the differences; you will only gain marks for explaining.
Issues caused by changing population structure
What is a dependent population?
In all countries, there is a dependent population
These are people of non-working age
Youthful dependents 0-15 years
Ageing dependents over 65 years
The dependent population relies on the economically active population 16-64 years old to support them
Demographic transition and dependent populations
In stages 1 and 2 of the demographic transition model, the population is younger, with large numbers of dependent children
In stages 3 and 4, the number of young people (under 15) starts to decrease
In stages 4 and 5, the number of older people increases, creating a dependent ageing population
Developing countries and dependent populations
High birth rates lead to high numbers of young (0-15 years) dependents in developing countries
Although this leads to a large potential workforce in the future, there are disadvantages, including:
Poverty because parents are providing for large numbers of children
Unemployment occurs because there are more people than jobs available
Pressure on education and healthcare services
Pressure on housing leads to the building of informal settlements, which lack infrastructure and basic services (water and electricity)
Lack of formal employment leads to the growth of informal employment
Increased crime rates due to poverty and lack of employment
Overcrowding
Developed countries and dependent populations
Low death rates and increased life expectancy mean that there are high numbers of elderly dependents in developed countries
This can lead to:
Increased spending on healthcare because elderly people are more likely to need medical treatment
More public services, including hospitals and social services, are needed
Increased demand for care/retirement homes
Higher total cost of pensions leading to tax increases for the working population
Lower economically active population

Unlock more, it's free!
Join the 100,000+ Students that ❤️ Save My Exams
the (exam) results speak for themselves:

Was this revision note helpful?
