UK Weather (SQA National 5 Geography): Revision Note
Exam code: X833 75

Specification checklist
This page covers what you need to know from the SQA National 5 geography specification to answer questions on:
Within the context of the United Kingdom:
The characteristics of the five main air masses affecting the UK
The characteristics of weather associated with depressions and anticyclones
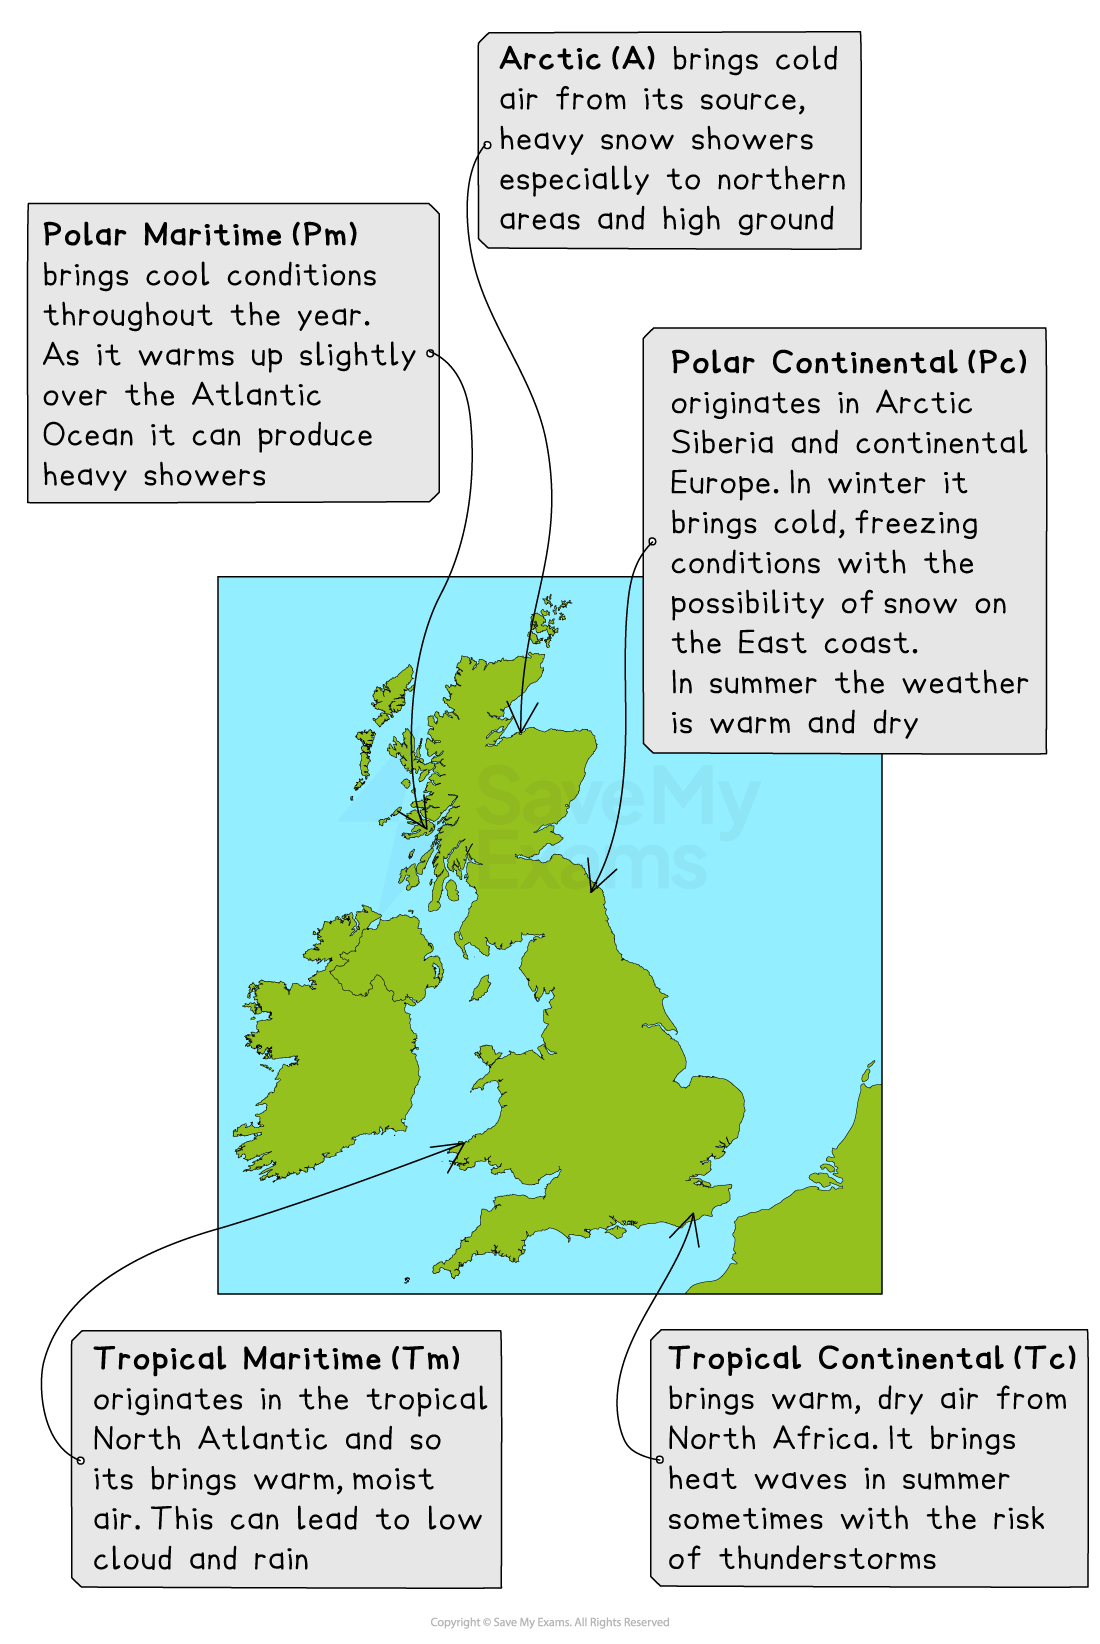
Five air masses affecting UK weather
What is an air mass?
An air mass is a large body of air that has similar moisture, density and temperature characteristics
A front is the boundary separating two air masses
Which air masses affect the UK?
Air masses are classified by the region where they form:
Arctic or Polar cold air
Tropical warm air
Maritime wet air
Continental dry air
Britain’s weather is dominated by Atlantic low-pressure systems (depressions or cyclones) that move across the British Isles from west to east
These bring a mix of warm tropical maritime air and cold polar maritime air
Cold air is denser, so it moves more quickly and undercuts warmer air at the rear of the depression or blocks its movement in at the leading edge of this feature
Weather associated with different air masses
Arctic Maritime (mA)
The source of the air mass is the Arctic Ocean
The weather characteristics are:
Very cold temperatures
Not always wet due to low humidity
Polar Continental (cP)
The source of the air mass is Northern Europe and Russia
The weather associated with this air mass is more common in winter than in summer
The air mass starts over Northern Europe and brings cold conditions in winter and milder conditions in summer
In winter, it can bring unstable air (which leads to snow) but usually brings cool, dry conditions
Tropical Continental (cT)
The source of the air mass is Southern Europe and North Africa
The weather associated with this air mass usually occurs in summer
Warm, dry air from North Africa and the Mediterranean brings warm, dry weather
Dust from the Sahara can be carried on the light winds and deposited in the UK
Tropical Maritime (mT)
The source of the air mass is the Atlantic Ocean
The weather associated with the air mass is warm and wet
Mild conditions in winter and wet conditions in summer
It brings cloud, drizzle and fog
Polar Maritime (mP)
The source of the air mass is the North Atlantic
The weather associated with the air mass is cold and wet
It is the most common air mass in the UK
It brings unstable air, which creates clouds
Can cause rainfall in the summer
Weather associated with anticyclones
An anticyclone is an area of high pressure, which brings long periods of settled weather
The air in a high-pressure area is sinking, which means clouds do not form, so conditions are dry
Characteristics of high-pressure systems on a synoptic chart include:
Widely spaced isobars (bringing gentle winds)
No fronts (so no clouds)
Isobars showing pressure increasing towards the centre and above 1008mb
Winds circulate clockwise, following the isobars
Weather associated with high-pressure systems (anticyclones) in summer
Anticyclones during the summer lead to high temperatures
Clear skies meansthere are no clouds to shade the surface of the Earth
It is exposed to the sun’s energy throughout the day
This increases the temperature
Evaporation occurs at the surface, but due to the high pressure and sinking air, it cannot move up and spread out in the atmosphere
This can cause intense thunderstorms to occur in the afternoon or early evening
Coastal areas on the east coast of Britain can be affected by sea fog (or haar) as warm, moist air travels over the relatively cool North Sea
The sinking cold air of the high-pressure system traps the warm, moist air below it, leading to fog formation
The impact of high-pressure systems in summer
Drought conditions reduce the yield of farmers’ crops
This can reduce the food supply and affect farmers’ profits
Hosepipe bans can make it difficult for gardeners and people with allotments, whose produce suffers in dry weather
People can suffer from sunburn and dehydration, especially infants and the elderly, who are most vulnerable
Wildfires can spread rapidly due to dry conditions
This endangers wildlife and buildings and increases the workload for the fire service
Severe thunderstorms from convectional rainfall can lead to localised flooding and travel disruption
Travel disruption can be caused by railway lines buckling in the intense heat
This can lead to trains being derailed
Weather associated with high-pressure systems (anticyclones) in winter
Anticyclones that occur during winter lead to:
Very low temperatures
Frost
Fog
The clear skies allow heat radiating from the earth to escape into the upper atmosphere
This lowers the temperature at the surface
Frost can form on the ground due to the low temperatures
In the early morning, there may be fog
This is because moisture in the air is trapped near the surface by the sinking air
It is unableto move up and spread out in the atmosphere or be distributed by winds.
Impact of high-pressure systems in winter
Frost/ice leads to more people falling over
This increases the workload for emergency departments
Fog can create travel disruption due to poor visibility
People’s moods improve as a period of bright, settled weather gives people the opportunity to see direct sunlight during the short winter days
People have to get up earlier to defrost vehicles before travelling, or may be late for work/school
Low temperatures can cause frost and lead to burst pipes, causing damage to property
Weather associated with the passage of a depression
A depression is an area of low pressure which moves from west to east in the northern hemisphere
In a depression, the air is rising
Low-pressure systems can be identified from a synoptic chart due to:
Cold fronts
Warm fronts
Possible occluded fronts
Tightly packed isobars, which means that winds are strong
Isobars showing pressure decreasing towards the centre from about 1004mb
As a depression passes over, the weather follows a particular sequence
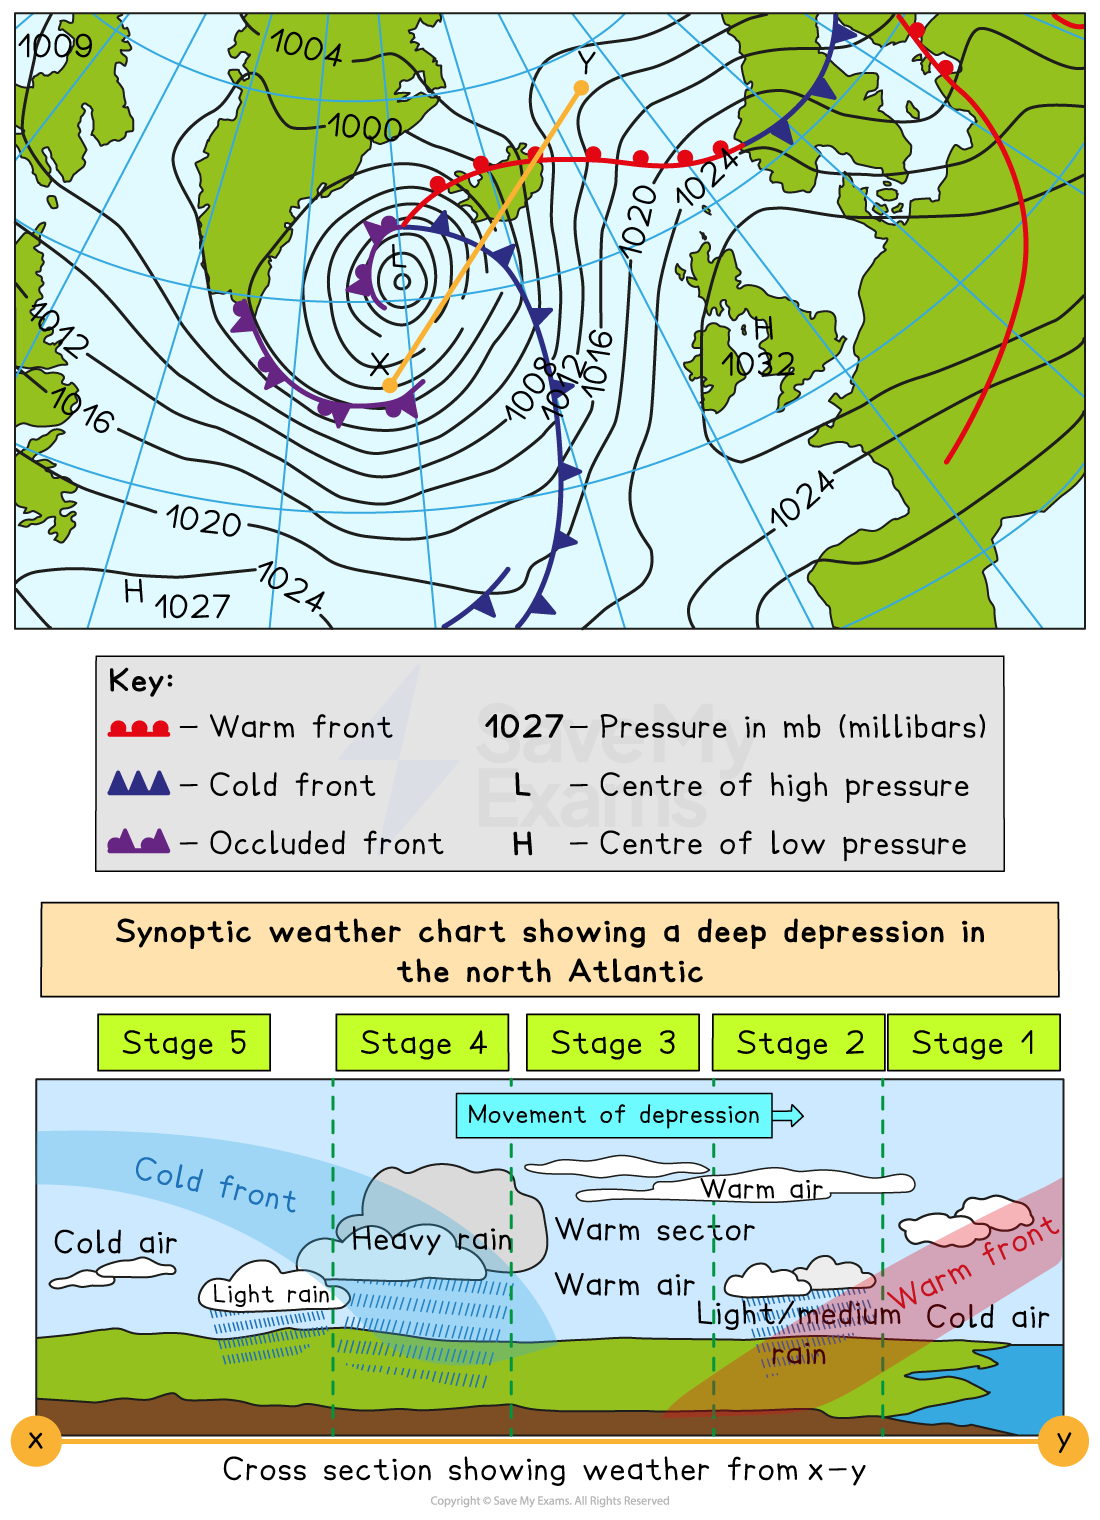
Stage 1
The depression approaches from the west
Weather changes
In the area ahead of the warm front is the cold sector
The weather is bright and sunny
High-level cloud (cirrus and cirro-stratus) begins to develop
Winds are light and south-westerly; they are beginning to increase in strength
Reasons for the changes
There are no fronts, so the weather is bright and sunny
As the warm front approaches, clouds start to appear due to warm, moist air rising above the cold air
As the isobars get closer together, the winds start to increase in strength
Stage 2
The warm front arrives
Weather changes
At the warm front, long periods of rain are experienced
There is dense cloud cover (stratus or strato-cumulus)
Wind speeds increase and may reach storm/gale force
The wind direction changes at the front, switching to westerly
Reasons for weather changes
A warm air mass, e.g. tropical maritime, is pushing in and moist air is forced to rise above the cool air ahead of it
The air cools, condenses and creates rainfall (frontal rainfall)
Wind speeds increase because isobars are close together
Air circulates anti-clockwise, so winds are now westerly
Stage 3
In the warm sector
Weather changes
The rain eases
The temperature rises
The warm air passes over
It may be dry, or there may be drizzle
Winds remain strong and westerly
Reasons for weather changes
This is a warm air mass, e.g. tropical maritime, which leads to higher temperatures
With distance from the warm front, cloud cover and rain decrease
Winds are still strong because the isobars are close together
Stage 4
The cold front arrives
Weather changes
There is heavy rain for a short time as the cold front passes
Temperatures drop as the cold air follows behind the cold front
Winds are now from the north-west as the front passes, bringing in colder weather
Reasons for the weather changes
The cold front is a steeper gradient than the warm front, so warm, moist air is forced to rise more rapidly
The air cools and condenses quickly, leading to heavy rainfall
The temperature drops because the cold front is introducing a cold air mass, e.g. polar maritime (winds from the North Atlantic)
Stage 5
Behind the cold front
Weather changes
Winds are still from the north-west as the front passes, bringing in colder air
Winds from the north-west are blustery at first, but wind speed decreases as the front moves away
Calmer conditions follow
Reasons for the weather changes
Behind the cold front is a cold air mass
Wind speed, cloud cover and precipitation decrease as the depression, with its associated fronts, move away
Synoptic charts
A synoptic chart is a detailed weather map which shows what type of weather system is moving over an area
The term synoptic means summary
The main weather element shown on a synoptic chart is air pressure
Isobar lines, which join up areas of equal air pressure, are drawn on these maps
The pattern these lines make shows areas of low or high pressure
The isobars also indicate wind speed
Isobars which are closer together indicate higher wind speeds
There are several other features on these maps, including isobars, low-pressure systems (and the associated fronts) and high-pressure systems
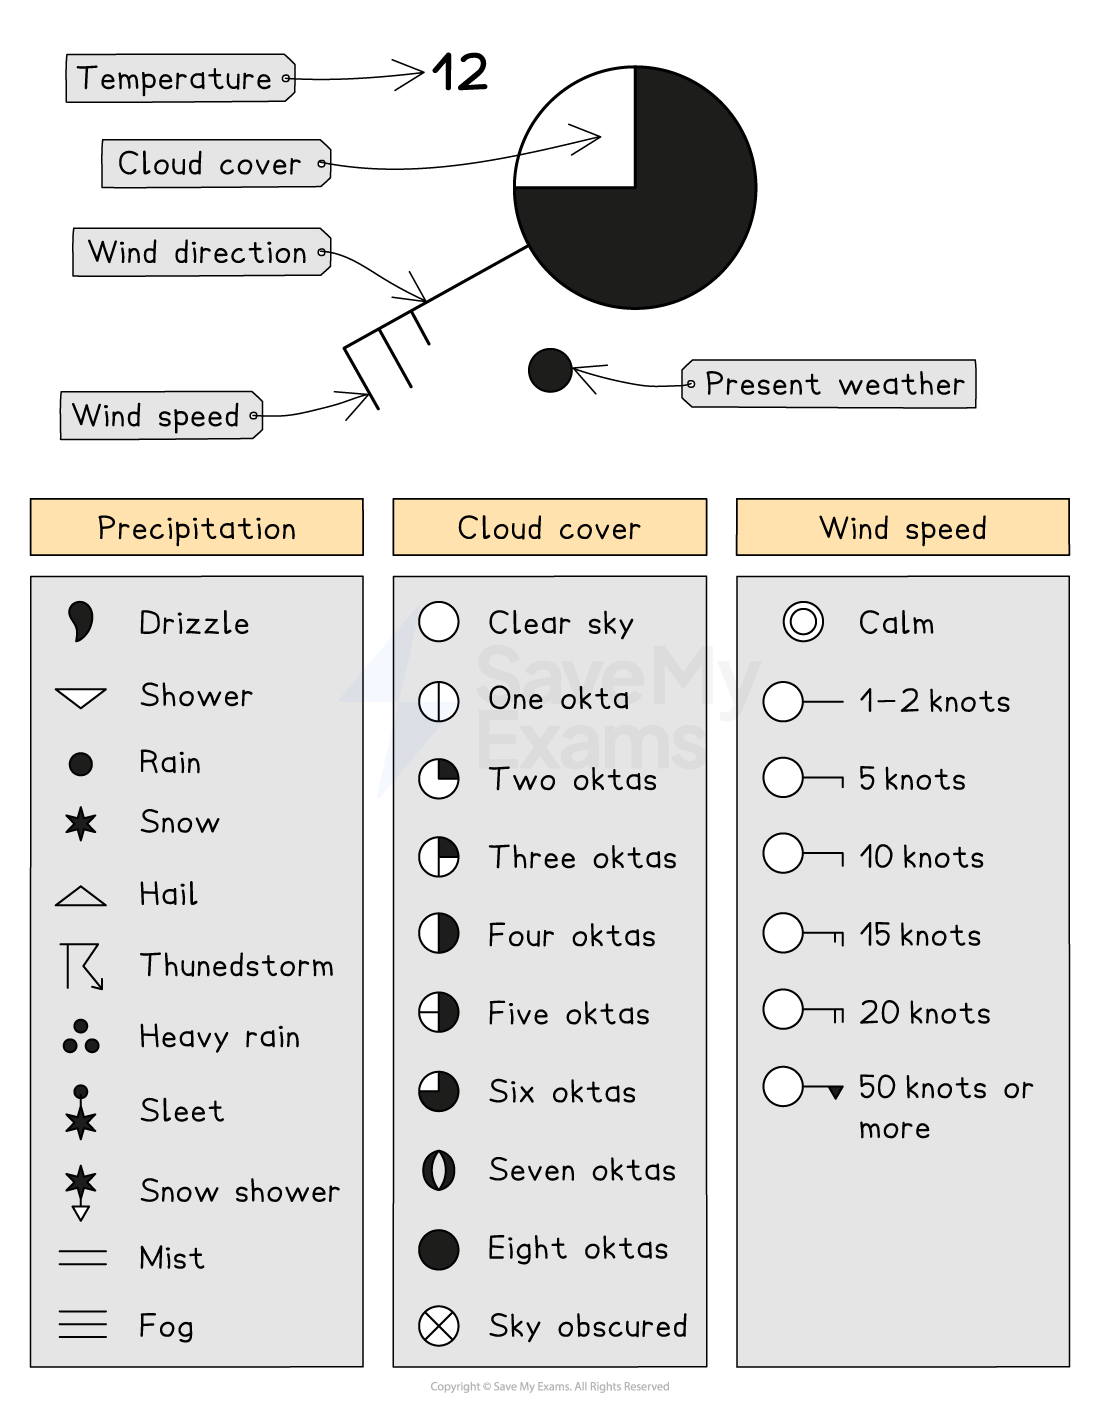
Station circles
Synoptic charts may also include station circles
These are used to show the temperature, cloud cover, wind direction and speed at specific weather stations
Worked Example
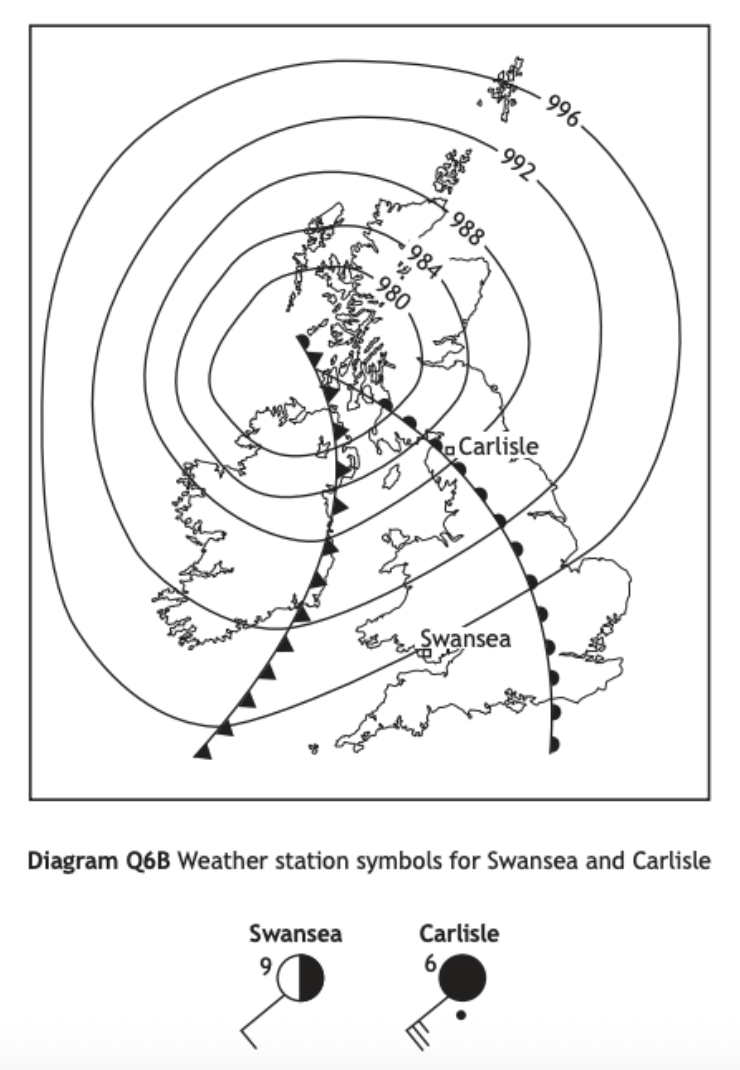
Study Diagram Q2A
Give reasons for the differences in weather conditions between Swansea and Carlisle
[4 marks]
There is a warm front over Carlisle, which brings more rain, as shown by the station circle. [1] The windspeed is 15 knots higher in Carlisle as the isobars are closer together. [1] Swansea is in a warm sector, which means that it will be drier as the lack of clouds lets the sunshine through. [1] This also explains the higher temperatures of 9oC. [1]

Unlock more, it's free!
Join the 100,000+ Students that ❤️ Save My Exams
the (exam) results speak for themselves:

Was this revision note helpful?
