1
3 marks
Study Figs. 5.2, 5.3 and 5.4, which are photographs showing different employment sectors.
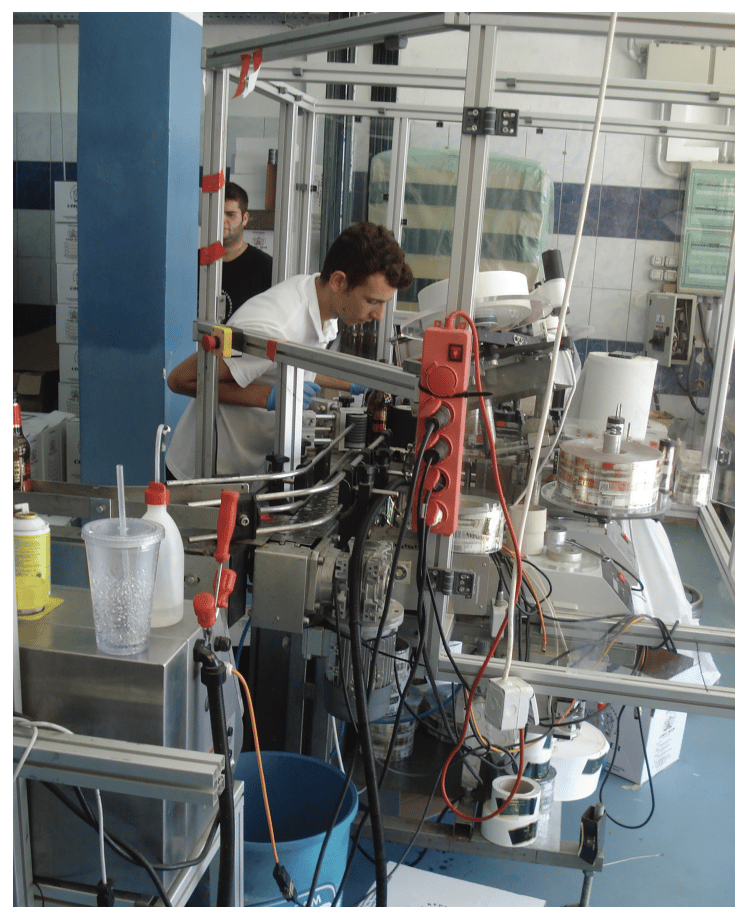
Fig. 5.2

Fig. 5.3

Fig. 5.4
Identify the employment sectors shown in each of Figs. 5.2, 5.3 and 5.4.
Was this exam question helpful?
Exam code: 2217
Syllabus Edition
First teaching 2025
First exams 2027
Study Figs. 5.2, 5.3 and 5.4, which are photographs showing different employment sectors.
Fig. 5.2
Fig. 5.3
Fig. 5.4
Identify the employment sectors shown in each of Figs. 5.2, 5.3 and 5.4.
Was this exam question helpful?
Identify what is meant by an economic sector.
The chain of production in manufacturing
An economic shift in employment
A classification of types of employment
A classification of employment structures
Was this exam question helpful?
Study Fig. 6.1 shows the employment structures of Germany (an HIC) and Egypt (an LIC) in 1960, 1985, and 2010.
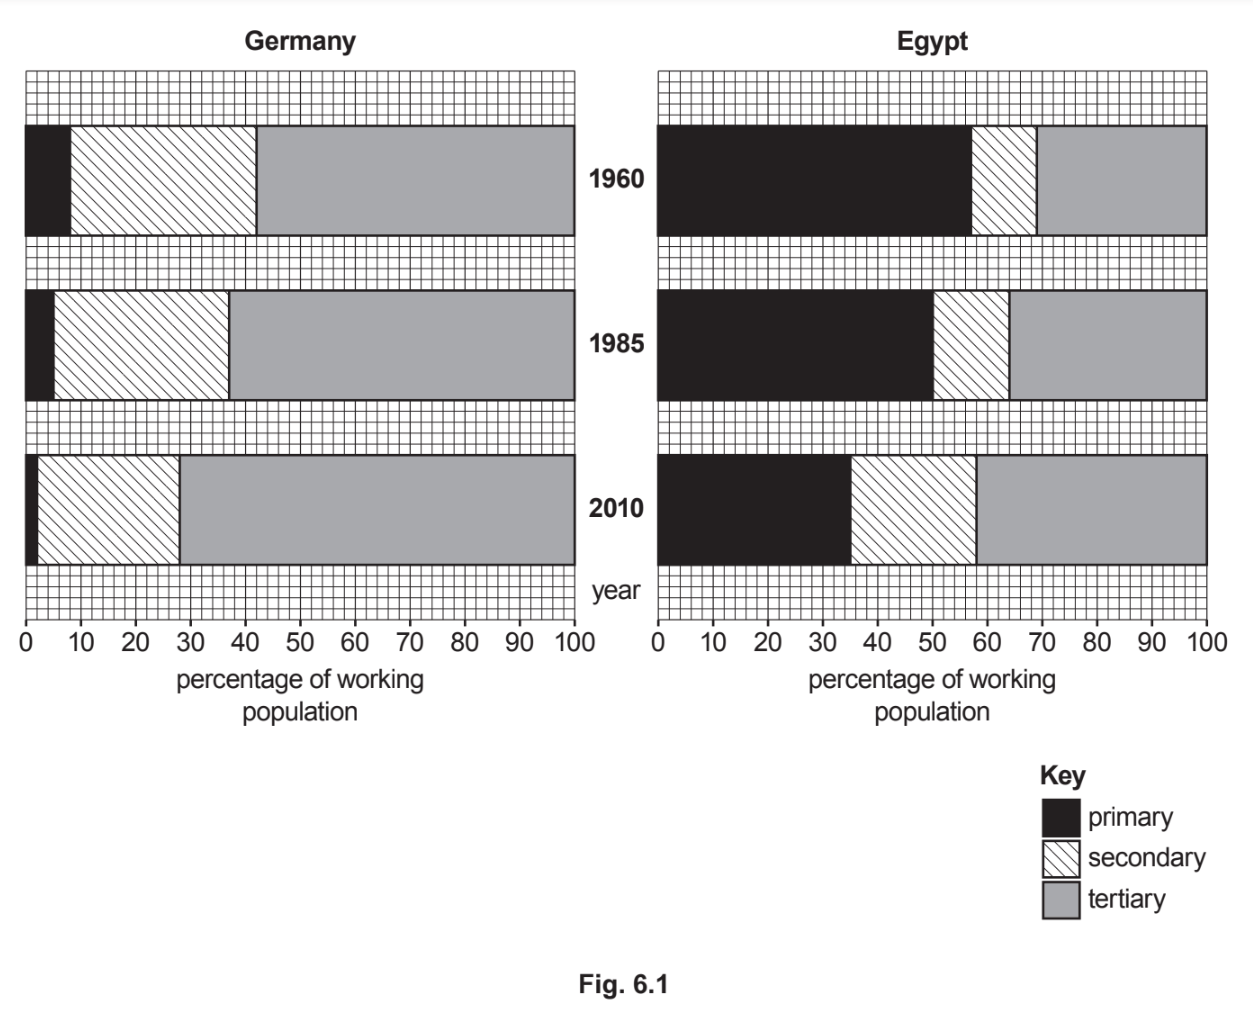
What percentage of the working population was employed in the primary sector in Egypt in 1960?
Identify one similarity and one difference between the employment structures of Germany and Egypt in 2010.
Similarity .......................
Difference .........................
Suggest reasons for the decline of employment in secondary industry in Germany since 1985.
Was this exam question helpful?
Identify one physical and one economic factor that affects an industry's location?
Was this exam question helpful?
Explain why the employment structure of a country is a good indicator of its level of development.
Was this exam question helpful?
Explain why employment in the primary sector is high in many low-income countries (LICs).
Was this exam question helpful?
Suggest reasons for the decline of secondary industry in many high-income countries (HICs).
Was this exam question helpful?
Study Fig. 1, the Clark-Fisher model.
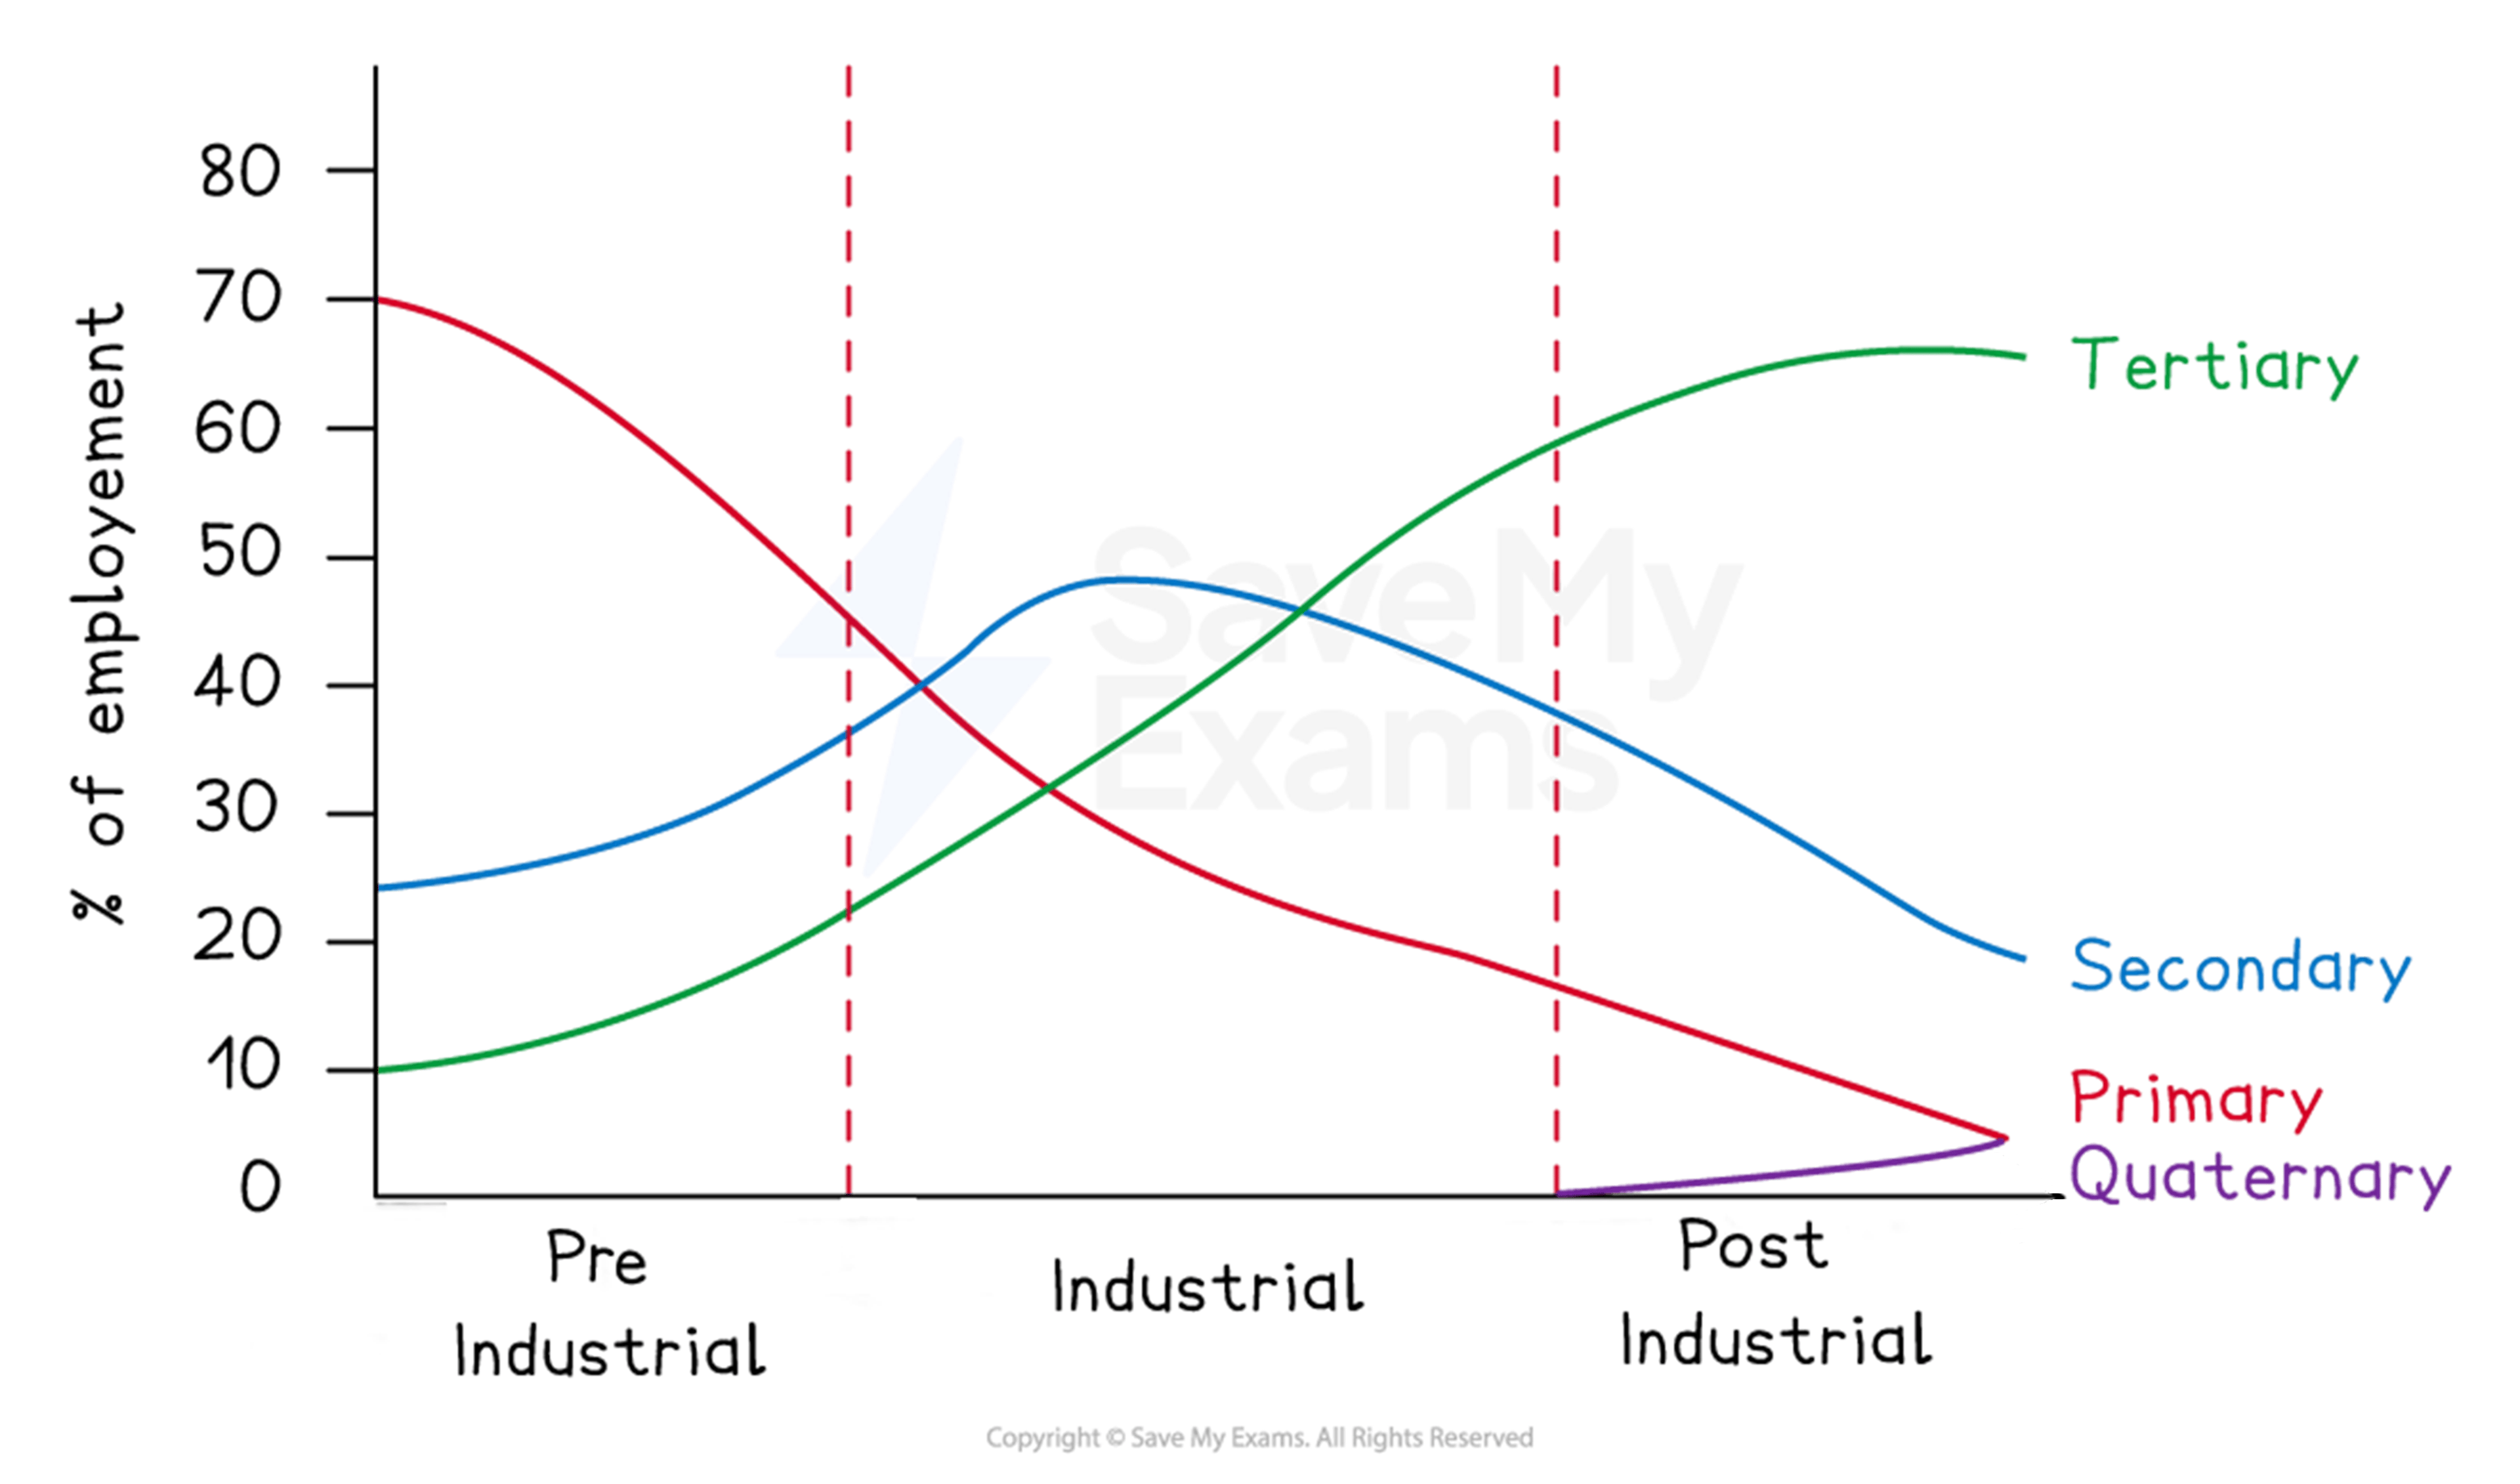
Using Fig. 1, describe how employment structure changes as countries develop.
Was this exam question helpful?
Suggest reasons why MICs often experience rapid growth in secondary sector employment.
Was this exam question helpful?
Evaluate the usefulness of employment structure data in showing a country’s level of development.
Was this exam question helpful?
Assess the impacts of deindustrialisation on people and places in HICs.
Was this exam question helpful?
Evaluate the extent to which globalisation is responsible for changing employment structures in MICs?
Was this exam question helpful?
Evaluate the social and economic impacts of growth in the tertiary and quaternary sectors in HICs.
Was this exam question helpful?
Assess the extent to which mechanisation changes employment structures in LICs and MICs.
Was this exam question helpful?