1
2 marks
Using the data in Extract A (Figure 2), calculate, to two decimal places, the mean growth rate for India from 2010 to 2014.
Case Study
Extract A

Was this exam question helpful?
Exam code: 7136
Using the data in Extract A (Figure 2), calculate, to two decimal places, the mean growth rate for India from 2010 to 2014.
Extract A
Was this exam question helpful?
Using the data in Extract A (Figure 1), calculate the mean unemployment rate for the UK from 2007–08 to 2017–18. Give your answer to one decimal place.
Extract A

Was this exam question helpful?
Using the data in Extract A, calculate the GDP per capita for Costa Rica in 2015/2016 to the nearest dollar.
Extract A

Was this exam question helpful?
Explain how the data in Extract A indicate living standards may be higher in the UK than in the USA.
Extract A
Was this exam question helpful?
Extract A
Explain how the data in Extract A (Figure 2) show that the UK has had poor real wage growth since 2008.
Was this exam question helpful?
Explain why the data in Extract A (Figure 1) show that living standards in India have improved.
Extract A
Was this exam question helpful?
Inflation resulted in a basket of goods and services that cost £100 in 2015 costing £112 in 2021. Using this information and the data in Extract A (Table 1), calculate the percentage increase in average university rent, in real terms, between 2015 and 2021.
Give your answer to one decimal place.
Extract A

Source: Cushman Wakefield Student Accommodation Report, 2022
Was this exam question helpful?
Using the data in Extract A, calculate the ratio of the UK’s GDP per hour worked to $1 of GDP per hour worked in Hungary.
Give your answer to two decimal places
Extract A: Indicators of economic performance and living standards, selected nations, 2021
Productivity (GDP per hour worked, US $) | Productivity change 2010–2021 (%) | Life expectancy at birth (years) | Gini coefficient | Expected years of schooling (years) | CO2 emissions per capita (tonnes) | |
|---|---|---|---|---|---|---|
Estonia | 42.9 | +28.8 | 77.1 | 0.308 | 15.9 | 7.9 |
Hungary | 39.9 | +16.7 | 74.5 | 0.300 | 15.0 | 5.0 |
UK | 59.1 | +3.5 | 80.7 | 0.351 | 17.3 | 4.9 |
Source: OECD & WHO, 2022
Was this exam question helpful?
Using the data in Extract D, calculate the percentage change in Vietnam’s GDP per capita between the years 2010 and 2021.
Give your answer to one decimal place
Extract D: Macroeconomic performance indicators, selected Southeast Asian economies, 2010 to 2021
GDP per capita (constant prices, PPP) | Average annual growth rate 2010–2021 (%) | Average unemployment rate 2010–2021 (%) | Exports (% of GDP) | |||
|---|---|---|---|---|---|---|
2010 | 2021 | 2010 | 2021 | |||
Malaysia | 9 041 | 11 371 | 4.3 | 3.4 | 86.9 | 68.8 |
Thailand | 5 076 | 7 233 | 2.6 | 0.7 | 66.5 | 58.2 |
Vietnam | 1 673 | 3 694 | 5.9 | 1.6 | 54.2 | 93.3 |
Source: World Bank, 2022
Was this exam question helpful?
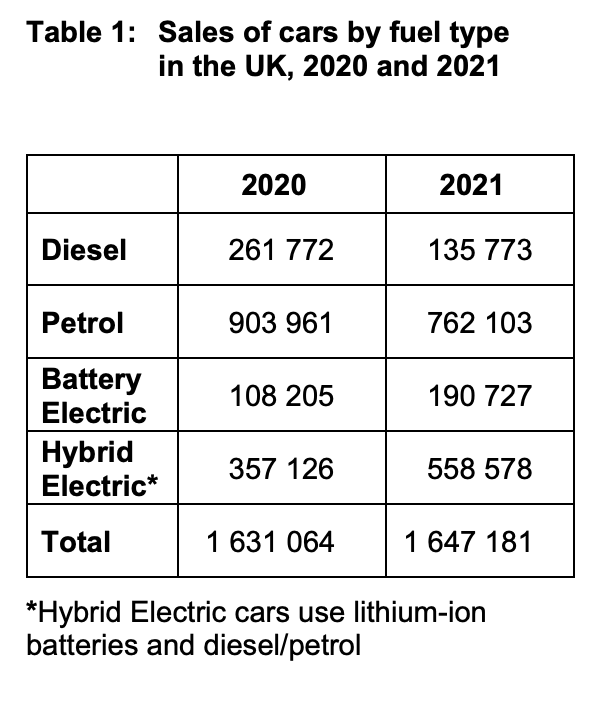
Using the data in Extract A (Table 1), calculate the index of total car sales in 2021 if, in the base year, total car sales were 1.25 million.
Give your answer to two decimal places
Was this exam question helpful?
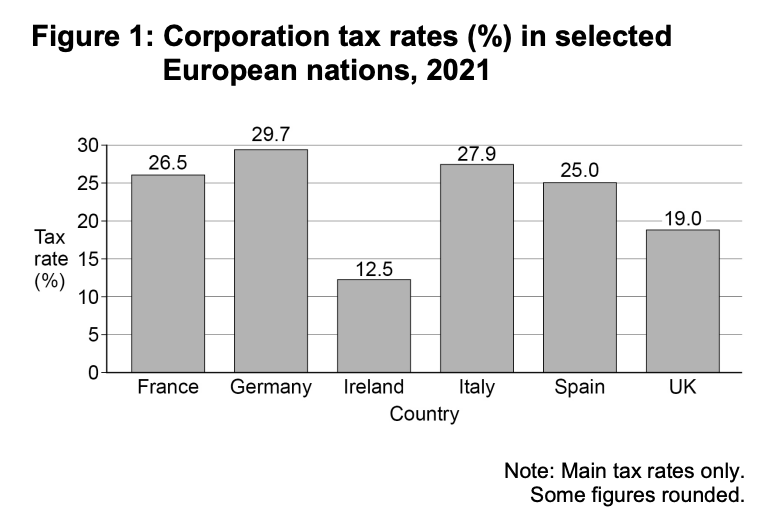
Using the data in Extract A (Figure 1), calculate the difference between Ireland’s corporation tax rate and the mean corporation tax rate of the other five European nations.
Give your answer to one decimal place
Was this exam question helpful?
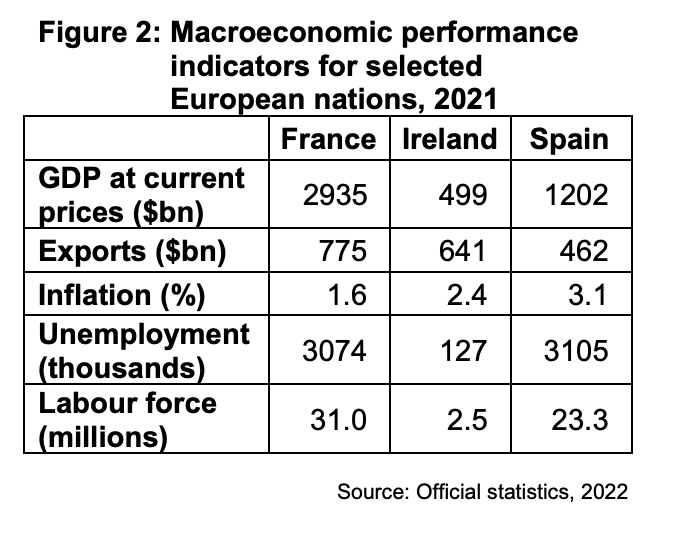
Explain how the data in Extract A (Figure 2), show that Ireland’s economy performed better than the economies of France and Spain in 2021.
Was this exam question helpful?
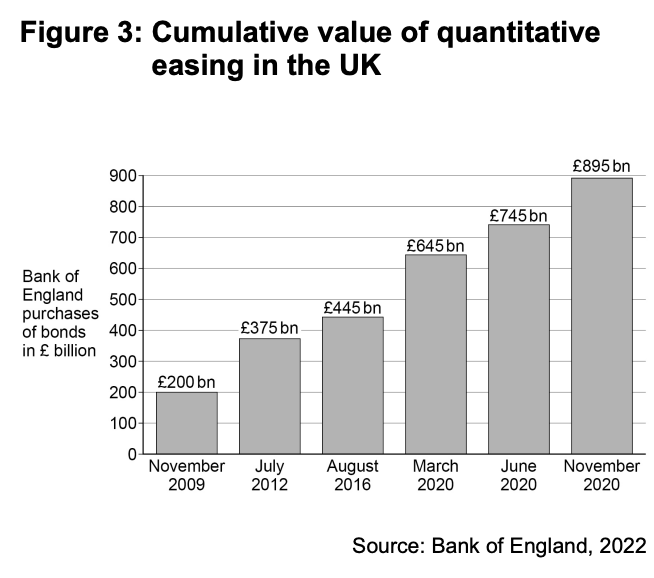
Using the data in Extract D (Figure 3), calculate the value of bonds that had been purchased by November 2020 for every £1 worth of bonds purchased by November 2009.
Give your answer in £s and to two decimal places
Was this exam question helpful?
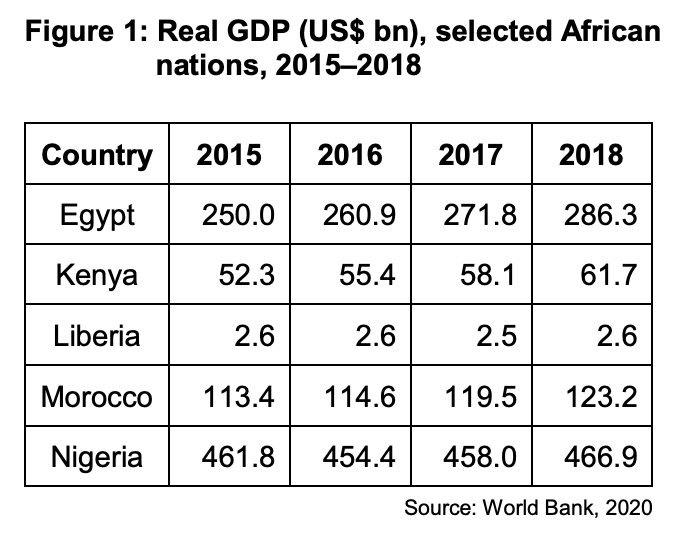
Using the data in Extract A (Figure 1), if 2015 is the base year, calculate the index of Egypt’s real GDP in 2018.
Give your answer to one decimal place
Was this exam question helpful?
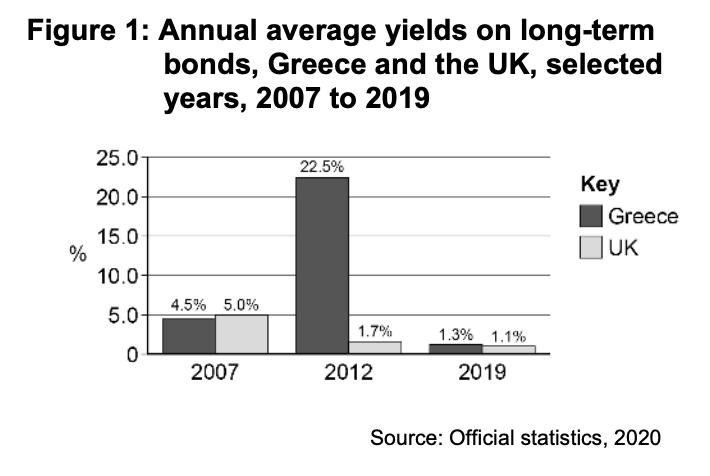
Using the data in Extract A (Figure 1), calculate the mean annual yield on long-term bonds in Greece over the years shown. Give your answer to one decimal place
Was this exam question helpful?
Using the data in Extract D (Figure 4), calculate South Korea’s rate of inflation for the year ended 31 December 2019. Give your answer to two decimal places

Was this exam question helpful?