Voting Behaviour (Edexcel A Level Politics): Revision Note
Exam code: 9PL0

Introduction to voting behaviour
Voting behaviour refers to the factors that influence how and why people choose to vote for a particular political party
Factors affecting voting behaviour in the UK
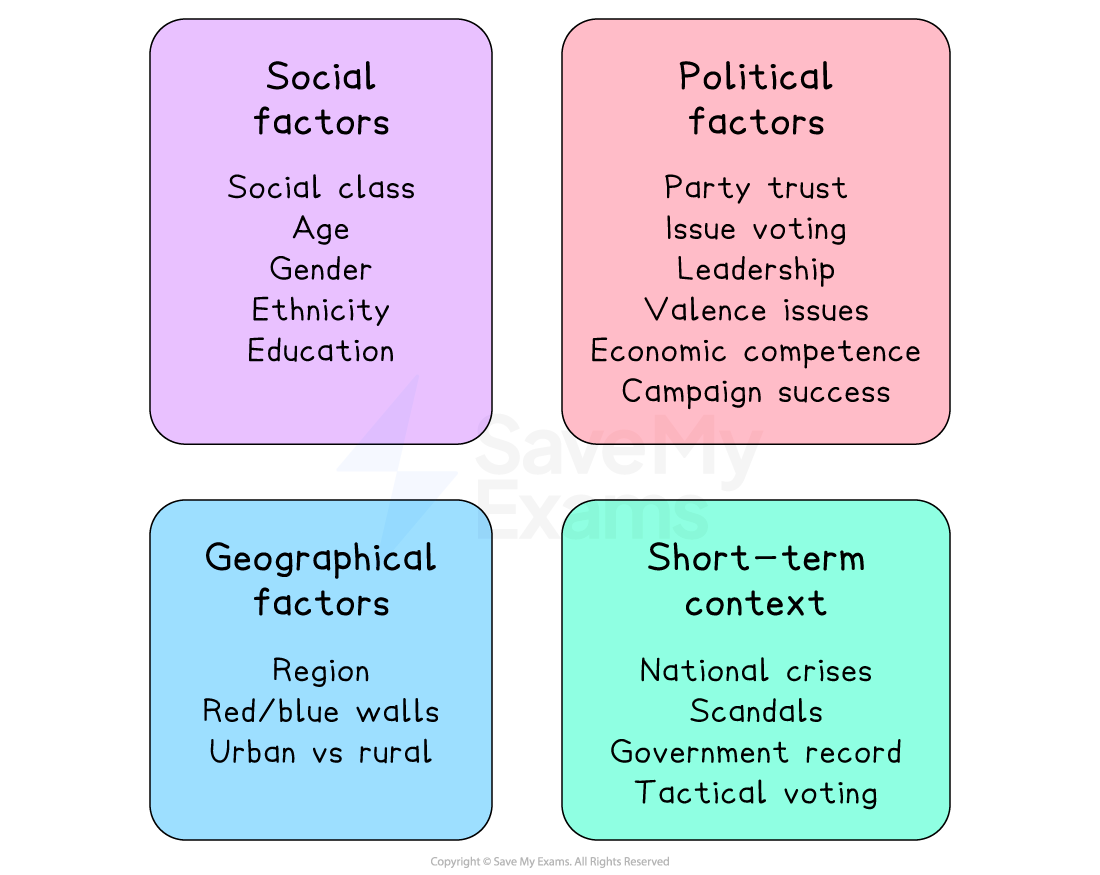
In the UK, this behaviour has become increasingly complex
Traditionally, factors such as social class, age, region, ethnicity, education and gender shaped predictable voting patterns
However, voters today are less tied to a single party and less likely to vote according to their social group
Major national events, perceptions of party competence, and attitudes toward issues such as Brexit, can be more important than demographic factors
Social class and voting behaviour
Social class refers to a way of grouping people in society based on their economic and social status, such as job type, income and education
Class dealignment is the weakening of the link between a person’s class and the traditional party with which they would have been aligned
Partisan dealignment is the long-term decline of a voter being loyal to just one party
Historically, social class was defined by income
Working-class voters were seen to be aligned with the Labour Party
Higher-earning middle-class voters and the upper-classes were aligned with the Conservative Party
Class in the UK today is usually defined by occupation rather than income, broken into ‘social bands’
Social class and the UK population
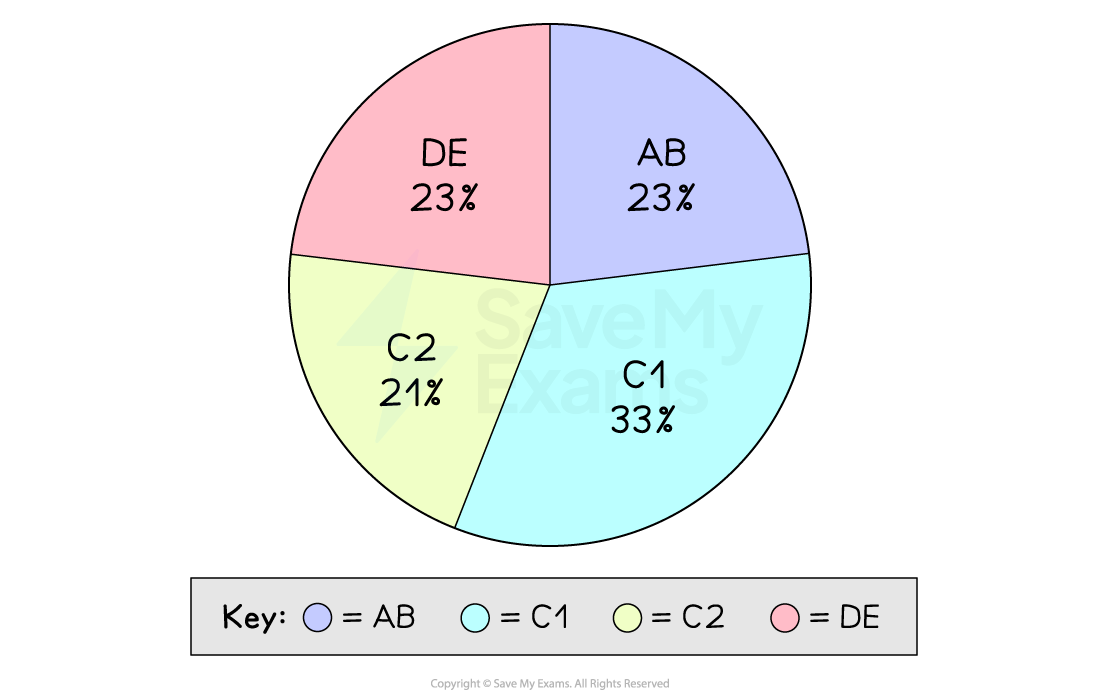
AB - Higher and intermediate managerial, administrative or professional roles
C1 - Supervisory or junior managerial, administrative or professional roles
C2 - Skilled manual workers
DE - Semi- and unskilled manual workers and unemployed
Class dealignment
Recent elections have seen class dealignment
Voters have not voted as expected by the social band, with other demographic factors becoming more important
In the 2024 general election, ‘traditional’ voting patterns were challenged in some ways, but they also reflected the importance of national circumstances
After 14 years of Conservative rule, austerity, Covid, and scandals such as Partygate, half of voters said that they voted Labour to ‘get the Tories out’
This undermines the importance of all demographic factors
Voting by social class in 2024
Social class | Labour | Conservative | Liberal Democrat | Reform | Green |
|---|---|---|---|---|---|
AB | 36% | 26% | 17% | 9% | 7% |
DE | 32% | 26% | 10% | 17% | 5% |
Age and voting behaviour
Younger voters have tended to vote for more left-wing parties, whilst older voters have tended to vote for more right-wing parties
In 1979, 18-24 year-olds cast 42% of their votes for Conservatives; this was just 5% in 2024
In 1979, 38% of 65+ year-olds voted Labour; this dropped to 23% in 2024.
However between 1979-2024, the 18-24 year-old vote for Labour remained around 40% and the 65+ vote for Conservatives remained around 45%
Older voters are also more likely to vote than younger voters
Less than half of 18-24 year-olds voted in 2024, whilst over three-quarters of over-65s voted
Age, along with education, was the most important factor for voting behaviour in 2024
Voting by age in 2024
Age group | Labour | Conservative | Liberal Democrat | Reform | Green |
|---|---|---|---|---|---|
18-24 | 41% | 5% | 16% | 8% | 19% |
65+ | 23% | 43% | 12% | 14% | 2% |
Region and voting behaviour
Red Wall and Blue Wall
Traditionally, Labour have had a stronger-voter base in the north (red wall), whilst the Conservative Party tended to perform better in the south and south-east (blue wall)
In the 2019 election, many ‘red wall’ seats fell to the Conservative Party
Vote share in red wall seats in the North-east, 2019
Party | Labour | Conservative | Liberal Democrat | Reform | Green |
|---|---|---|---|---|---|
Vote share | 24.5% | 30.6% | 21.9% | 14.0% | 6.9% |
The blue wall refers to parliamentary seats in the south that have traditionally voted Conservative
In the 2024 election, many ‘blue wall’ seats fell to the Labour Party
Vote share in blue wall seats in the South-east, 2024
Party | Labour | Conservative | Liberal Democrat | Reform | Green |
|---|---|---|---|---|---|
Vote share | 45.4% | 20.2% | 5.9% | 19.9% | 6% |
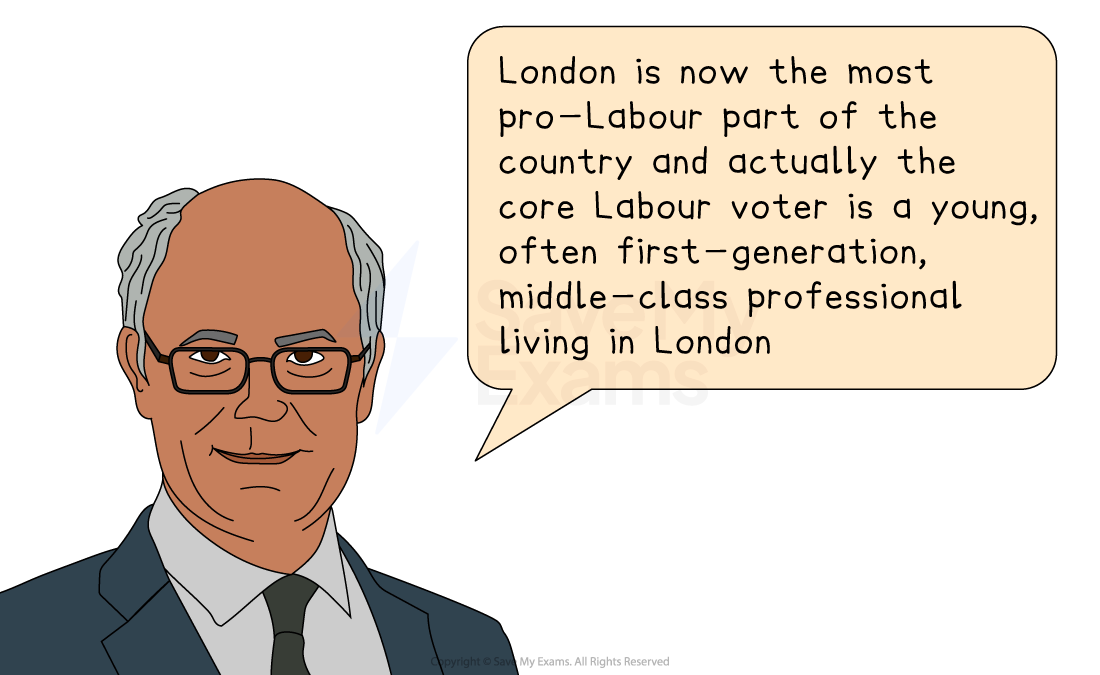
Voting behaviour in London
Since its inception, voters have elected a Labour Party Mayor of London on five out of seven occasions
London councils are overwhelmingly Labour-run and, in the 2024 general election, the Labour Party achieved a 43% vote share in the capital
Vote share in London, 2024
Party | Labour | Conservative | Liberal Democrat | Reform | Green |
|---|---|---|---|---|---|
Vote share | 43% | 20.5% | 11% | 8.7% | 10.1% |
Ethnicity and voting behaviour
Typically, the Labour Party has gained strong support from ethnic minority voters
The Conservative Party tends to enjoy stronger support from white voters
However, between 2019 and 2024 :
The Conservative Party saw a 22% drop in their share of white voters
Labour saw an 18% drop in their share of ethnic minority voters
Vote share by ethnicity, 2024
2024 Voting Group | Labour | Conservative | Liberal Democrat | Reform | Green | Other |
|---|---|---|---|---|---|---|
White voters | 33% | 26% | 13% | 16% | 6% | 6% |
Ethnic minority voters | 46% | 17% | 8% | 3% | 11% | 14% |
Ethnic minorities are not a homogenous group
In 2024 Asian voters, black voters, and mixed-race voters all showed slightly different voting patterns
Vote share by ethnic group, 2024
2024 Voting Group | Labour | Conservative | Liberal Democrat | Reform | Green | Other |
|---|---|---|---|---|---|---|
Asian voters | 39% | 18% | 8% | 3% | 11% | 21% |
Black voters | 68% | 16% | 6% | 1% | 8% | 2% |
Mixed voters | 50% | 14% | 11% | 7% | 13% | 5% |
Education and voting behaviour
Those who were educated to school-level were more likely to vote Labour in every election from 1979-2015
Graduates were more likely to vote Conservative
Since Brexit this has reversed
Graduates were more likely to have backed ‘Remain’ and and have subsequently backed Labour
School leavers were more likely to have backed ‘Leave’ and have subsequently backed the Conservatives
Education is related strongly to age
In 2001 only 20% of voters were graduates
In 2031 graduates are expected to outnumber school leavers
Education, along with age, was the most important factor in determining voting behaviour in 2024
Vote share by level of education, 2024
Qualification | Labour | Conservative | Liberal Democrat | Reform | Green |
|---|---|---|---|---|---|
None | 28% | 39% | 4% | 18% | 3% |
Degree or higher | 43% | 19% | 16% | 7% | 9% |
Gender and voting behaviour
Historically, women have been slightly more likely to vote for left-leaning parties
Men have been slightly more likely to vote for right-leaning parties
In 2024, this gender gap narrowed
34% of men and 35% of women voted Labour
23% of men and 26% of women voted Conservative
There is a relationship between age and gender
Labour received more votes from younger women than younger men
Conservatives received more votes from older women than older men
Around 20% of older men were inclined to vote for Reform

Unlock more, it's free!
Join the 100,000+ Students that ❤️ Save My Exams
the (exam) results speak for themselves:

Was this revision note helpful?
